Home

Redberry blog

Trading guides that show the chart, not just the theory

Every guide here is written for people who actually place trades on Quotex. Candlestick and chart patterns, smart money concepts, ICT tools, session timing, and how the Redberry desk reads Live and OTC pairs. Signals are never certain, so each guide is blunt about where a setup fails.

Start here

All guides

Diagram of how REDBERRY generates signals, from the TradingView and OTC price feeds through inbuilt strategies to an UP or DOWN call

Redberry18 Sept 202614 min read

How REDBERRY Generates Live and OTC Signals

The data path behind a REDBERRY signal: TradingView for Live pairs, private Quotex API for OTC, then inbuilt strategies and an expiry window.

The REDBERRY license process card showing a Trader ID field, a 16 character license key and the one seat rule

Redberry18 Sept 202615 min read

REDBERRY License and Seat Rules Explained

How a REDBERRY license key is issued, why only one desk can stay open at a time, and how the $10 balance rule ends and restores access.

Bullish engulfing candle at support and bearish engulfing candle at resistance on a forex chart

Candlestick patterns18 Sept 202614 min read

Bullish and Bearish Engulfing Candles: Exact Rules

Bullish and bearish engulfing rules explained: body versus wick engulfing, what makes one valid, entry and invalidation levels, and the false signals to skip.

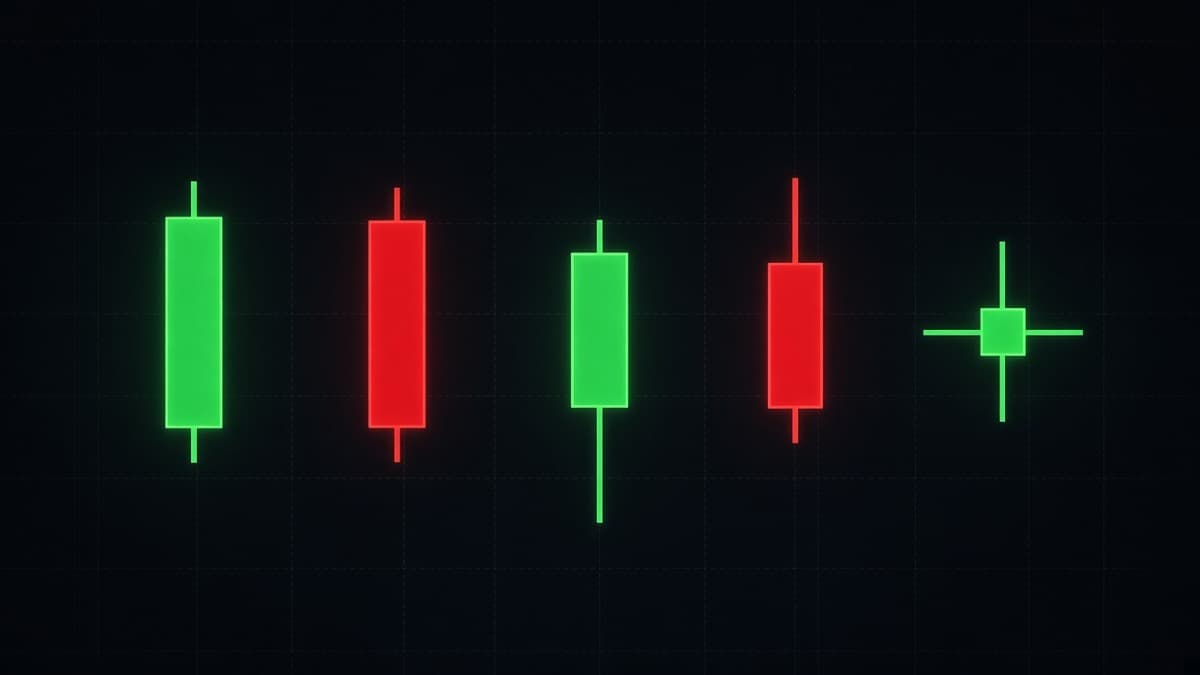
Doji candlestick patterns showing standard, long legged, dragonfly and gravestone doji candles on a price chart

Candlestick patterns18 Sept 202613 min read

Doji Candlestick Patterns: What They Really Mean

Doji candlestick patterns explained: standard, long legged, dragonfly and gravestone, plus what indecision means inside a trend versus at a tested level.

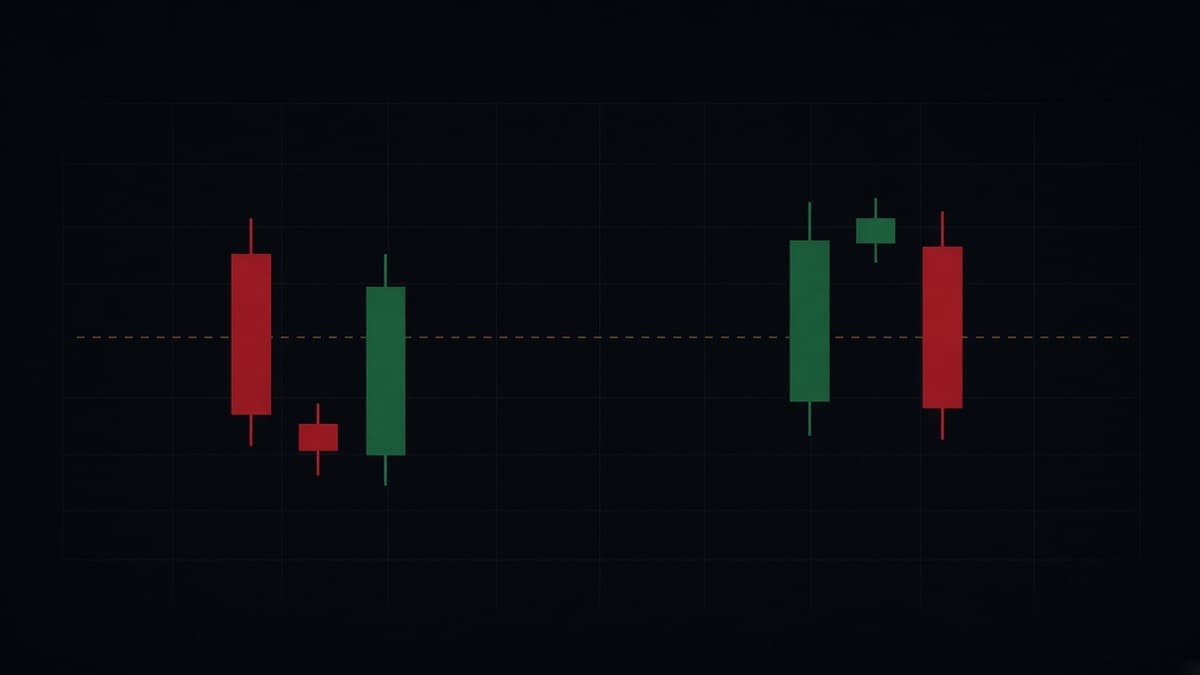
Morning star and evening star candlestick patterns showing the three candle reversal sequence on a price chart

Candlestick patterns18 Sept 202613 min read

Morning Star and Evening Star Patterns Explained

Morning star and evening star patterns explained: the three candle sequence, the midpoint rule, gaps on 24 hour markets, and behaviour on short expiries.

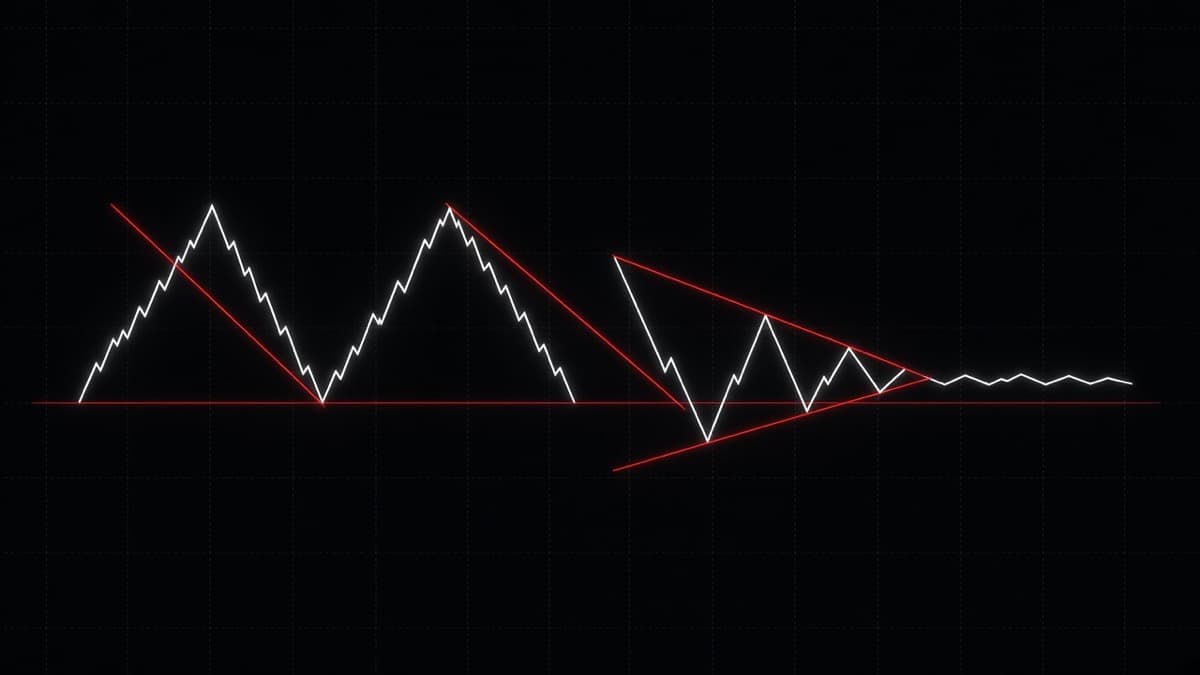
Chart patterns diagram showing a double top, a head and shoulders, an ascending triangle and a bull flag with necklines, trendlines and breakout arrows

Chart patterns18 Sept 202624 min read

Chart Patterns: A Complete Guide for Traders

Chart patterns explained the way traders use them: continuation versus reversal, where the neckline sits, measured targets, and how breakouts fail.

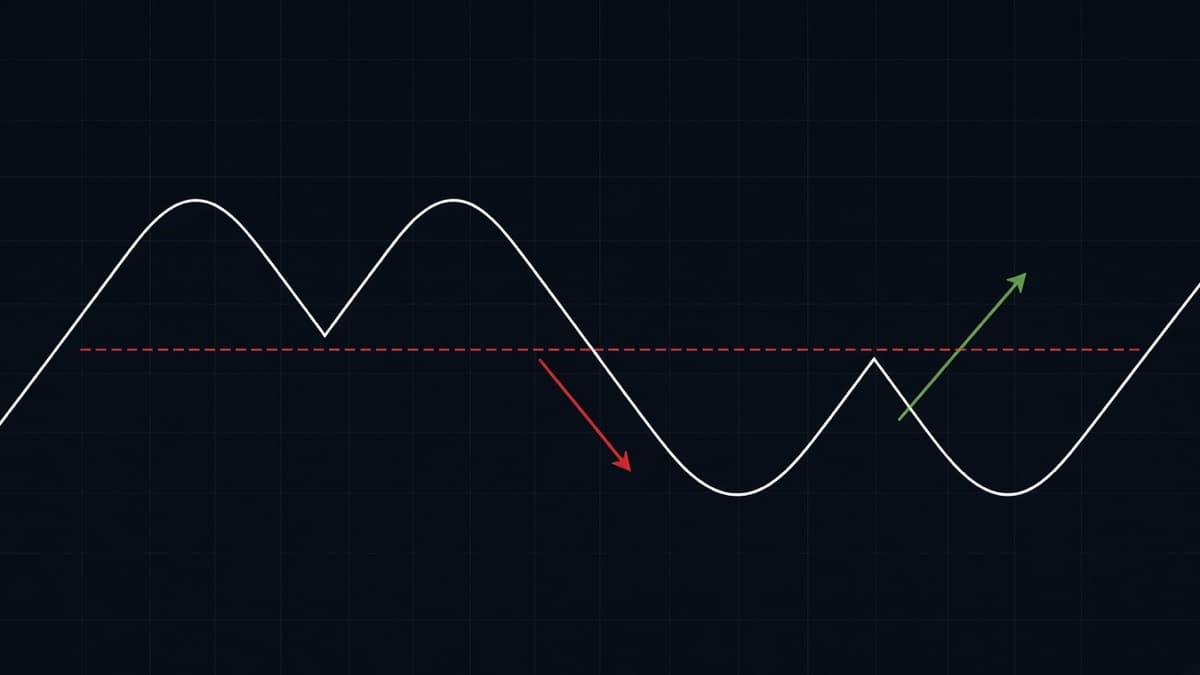
Double top and double bottom pattern chart showing two equal highs, two equal lows, the neckline and the breakout arrow

Chart patterns18 Sept 202614 min read

Double Top and Double Bottom Patterns Explained

Double top and double bottom trading explained: where the neckline goes, why equal highs matter less than the break, retests, targets and the failed version.

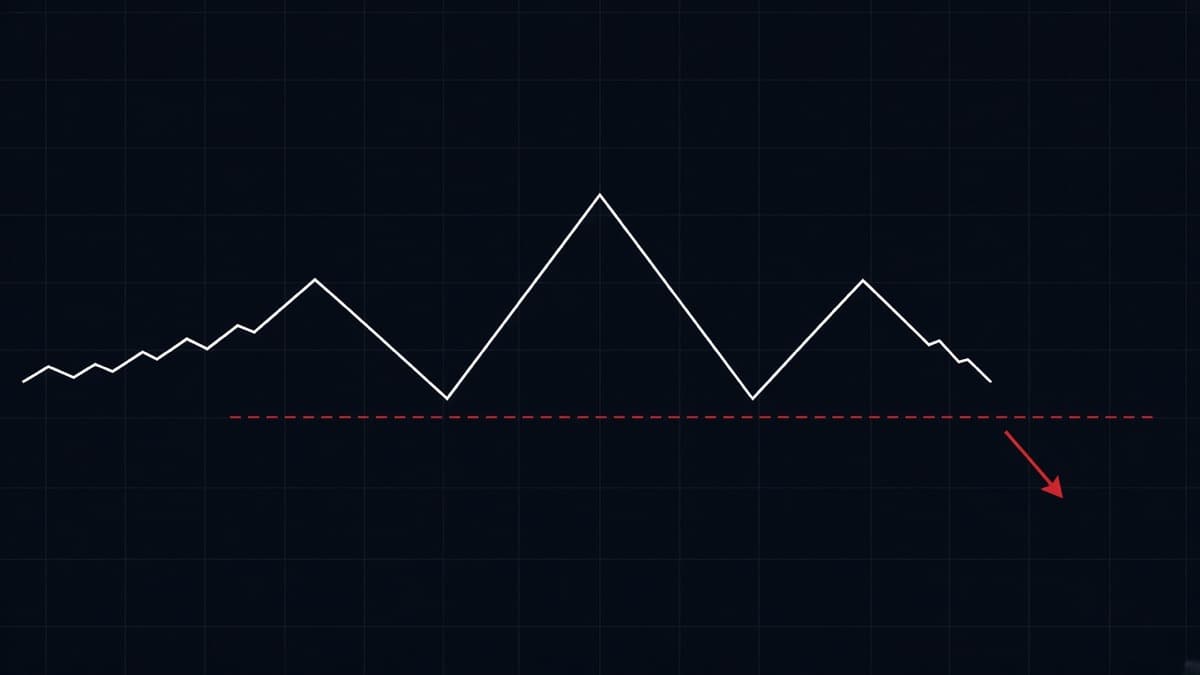
Head and shoulders pattern chart with the left shoulder, head, right shoulder, neckline and the breakdown arrow marked

Chart patterns18 Sept 202615 min read

Head and Shoulders Pattern: How to Trade It

Head and shoulders explained by a trader: drawing the neckline, sloping necklines, the inverse pattern, measured targets, retests and what invalidates it.

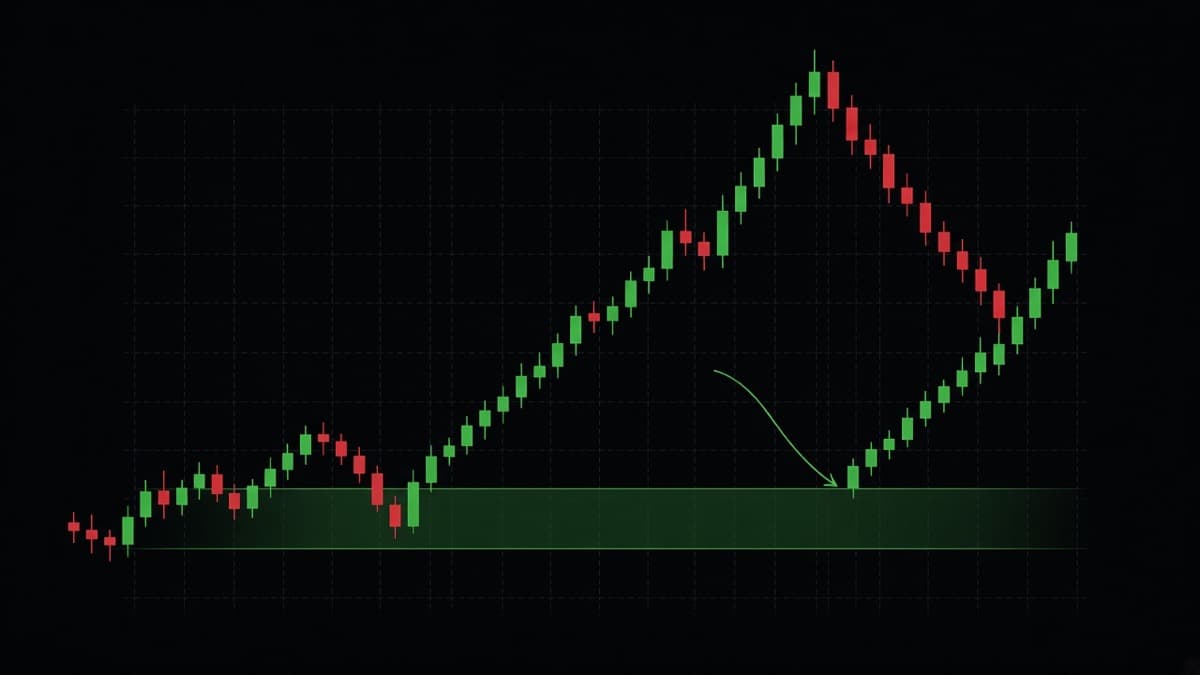
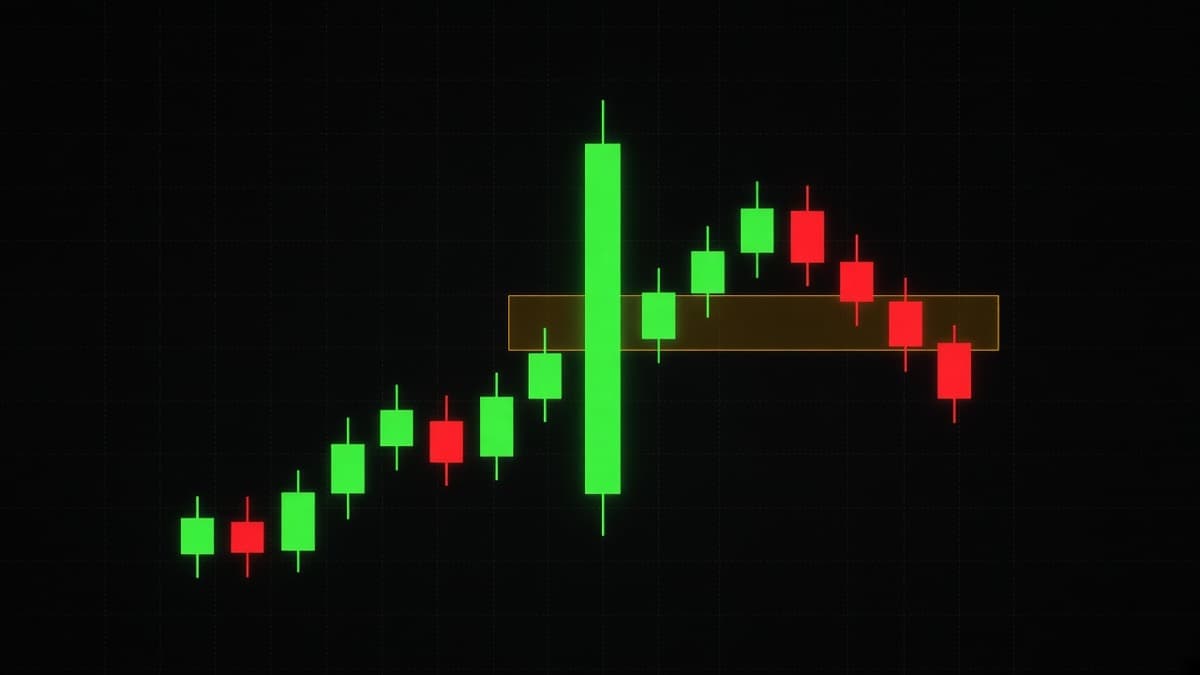
Smart money concepts chart showing market structure, an order block zone, a fair value gap and a liquidity sweep

Smart money concepts18 Sept 202622 min read

Smart Money Concepts: A Complete Trading Guide

Smart money concepts explained without the mystique: market structure, break of structure, order blocks, fair value gaps, liquidity and premium versus discount.

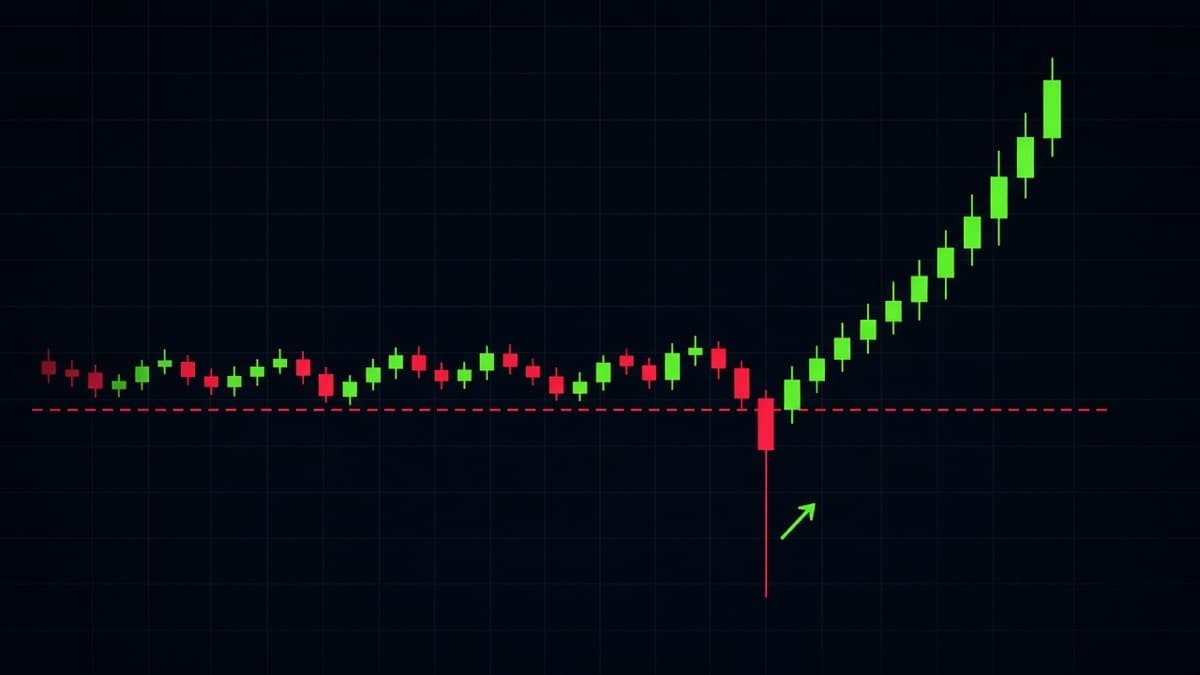
Liquidity sweep on a candlestick chart showing a wick spiking below equal lows before price reverses upward

Smart money concepts18 Sept 202617 min read

Liquidity Sweeps and Stop Hunts Explained

Liquidity sweeps explained: where resting orders sit, how to read the sweep wick, equal highs and lows, and how to tell a sweep from a real break of a level.

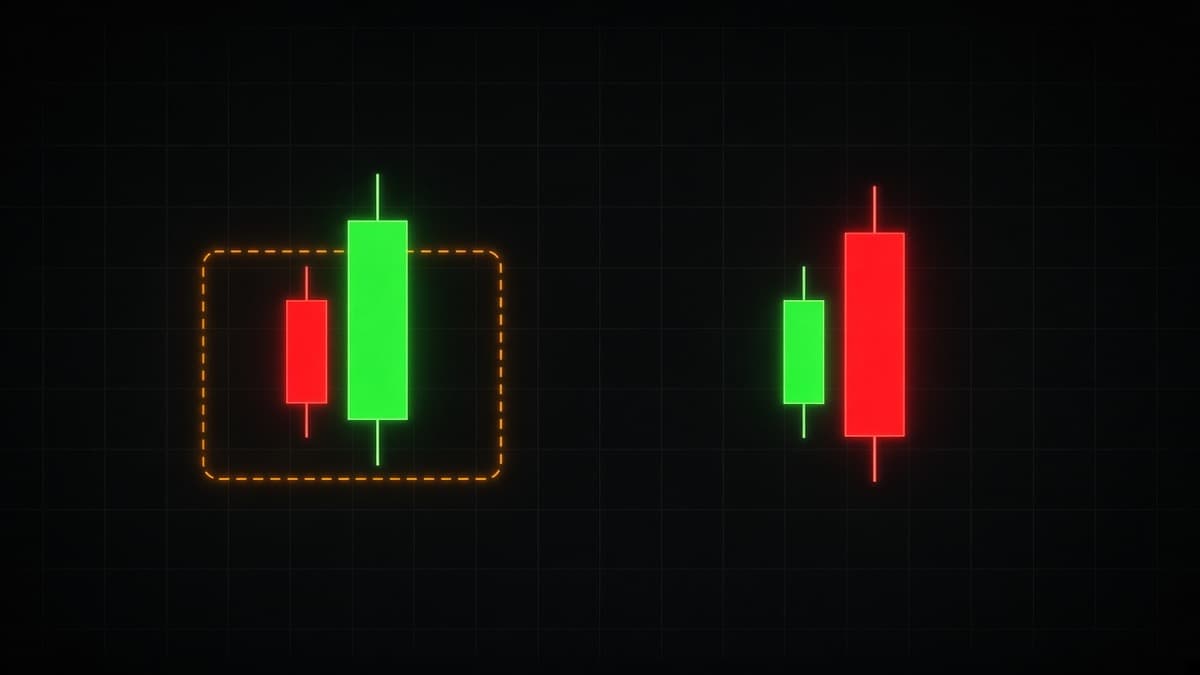
Two glowing candlestick panels side by side, used to introduce a Chinese Bot vs Redberry AI Bot comparison

Bot comparisons18 Sept 20267 min read

Chinese Bot vs Redberry AI Bot

Chinese Bot is a name that travels in trading groups. Here are the checks to run on it, and what Redberry AI Bot documents about its own price feed.

A dark candlestick chart rising through a marked price level, illustrating a Japanese Bot vs Redberry AI Bot comparison

Bot comparisons18 Sept 20266 min read

Japanese Bot vs Redberry AI Bot

Japanese Bot borrows the prestige of candlestick charting. Here is how to test whether a signal tool reads candles at all, and what Redberry does instead.

Two neon chart panels side by side, illustrating an Irani Bot vs Redberry AI Bot comparison on timeframes

Bot comparisons18 Sept 20267 min read

Irani Bot vs Redberry AI Bot

An Irani Bot call is only usable if it names a window. This compares both tools on timeframe control, expiry fit and what each one documents about its feed.

A dark card with a glowing red padlock beside faint candles, used for a Pakistani Bot vs Redberry AI Bot comparison on access and licences

Bot comparisons18 Sept 20267 min read

Pakistani Bot vs Redberry AI Bot

Pakistani Bot usually reaches traders as a shared file or a group link. Here is what to check before installing one, and how the Redberry desk is accessed.

Rising red and green candles with one marked level, used for a Meeru Bot vs Redberry AI Bot comparison on accuracy claims

Bot comparisons18 Sept 20266 min read

Meeru Bot vs Redberry AI Bot

Meeru Bot gets judged on screenshots. This compares both tools on measurable things: how accuracy is worded, what gets logged, and where the price comes from.

A candlestick panel with dotted green data streams flowing out of it, illustrating the price feed question in an Amixfx Bot vs Redberry AI Bot comparison

Bot comparisons18 Sept 20266 min read

Amixfx Bot vs Redberry AI Bot

Amixfx Bot compared with Redberry AI Bot on the question that decides everything: where the price comes from, and whether it matches the book you trade.

Two glowing chart panels side by side representing Live and OTC coverage in a YQT Bot vs Redberry AI Bot comparison

Bot comparisons18 Sept 20266 min read

YQT Bot vs Redberry AI Bot

YQT Bot compared with Redberry AI Bot on coverage: interbank Live pairs, platform OTC books, weekend trading, and which platform each side actually fits.

A glowing red padlock on a dark card, illustrating paid access in a Spider VIP Bot vs Redberry AI Bot comparison

Bot comparisons18 Sept 20266 min read

Spider VIP Bot vs Redberry AI Bot

Spider VIP Bot compared with Redberry AI Bot on the money question: what a VIP tier should buy, how each side is funded, and what neither one can promise.