Japanese Bot vs Redberry AI Bot
Japanese Bot borrows the prestige of candlestick charting. Here is how to test whether a signal tool reads candles at all, and what Redberry does instead.
Japanese Bot has a name that does a lot of work before you have seen a single call. Candlestick charting came out of Japanese rice markets in the eighteenth century, the vocabulary every trader uses (doji, hammer, engulfing) is Japanese, and a bot carrying that label sounds like it inherited the lineage. It might read candles carefully. It might not read them at all. The name cannot tell you which, so this article is about how to find out.
Where the Japanese Bot name gets its weight
Strip the branding and a signal tool is a function: something goes in, UP or DOWN comes out. The interesting part is what goes in.
A tool that genuinely reads candles can tell you which candle it read. Not a philosophy, a candle: the one minute EUR/USD candle that closed at 14:32, the wick that swept the low, the body that closed back above it. If the supplier of a Japanese Bot build can answer at that level of detail, you have something you can check against your own chart. If the answer is that the algorithm is private, you are back to trusting an arrow.
I have no public documentation for any Japanese Bot build, so I will not tell you what it does or does not read. What I can tell you is what a candle based read looks like when it is real.
That is a reason. It has a level, a sequence and a bar you can point at. Anything described only as high accuracy is not a reason, it is a claim.
Ask which candle, then check the chart yourself
Here is a test that costs nothing and settles most arguments about any signal tool.
Take ten calls. For each one, write down the pair, the direction, the exact minute, and then open the same chart and look at the last closed candle before the call. You are asking one question: is there anything on that chart that would make this direction sensible? A level being tested, a sweep, a structure break, a pattern from the candlestick patterns guide.
Two outcomes are useful. If most calls line up with something visible, the tool is reading structure and you can start assessing how well. If the directions look unrelated to the chart, you have learned that too, without a single stake at risk.
Do that before you fund anything. It works on Japanese Bot, on REDBERRY and on the signal channel your cousin swears by.
What REDBERRY reads before it prints UP or DOWN
REDBERRY's answer to the "which candle" question is published rather than hinted at.
Live pairs run on the TradingView API, which supplies realtime price and chart structure, and inbuilt strategies read that structure to predict the next move. The Live tab is 17 FX pairs written with a slash, and the generate time is always 1m. Fixed window, so the call is always about the next minute and never about an unspecified stretch of time.
OTC runs on private Quotex API access, which gives a live OTC price feed, with the same strategies on top. There you select the pair and the timeframe yourself from the platform's list.
The desk also states the limit. Signals are not 100 percent accurate. A structure read is an edge, not a certainty, and the difference matters because it changes how you size.
Anyone selling candlestick certainty is selling the one thing candlesticks cannot give. How REDBERRY generates Live and OTC signals walks through the whole scan, and Redberry AI Bot explained covers the product without the sales voice.
A worked example, so the test is concrete
Say a call arrives for EUR/USD, UP, at 14:32. You open a one minute chart and look at the candle that closed at 14:31. Three things are worth reading, in this order.
Location first. Is that candle sitting at a level price has already reacted to twice this session, or is it floating in the middle of a range with nothing above or below it? A bar means something at a level and very little in open space.
Then the wick. A long lower wick on that candle says price went down and came back, so sellers tried and failed inside sixty seconds. A long upper wick says the opposite. A candle with wicks both sides and a tiny body says nobody won, which is a reason to skip rather than to enter.
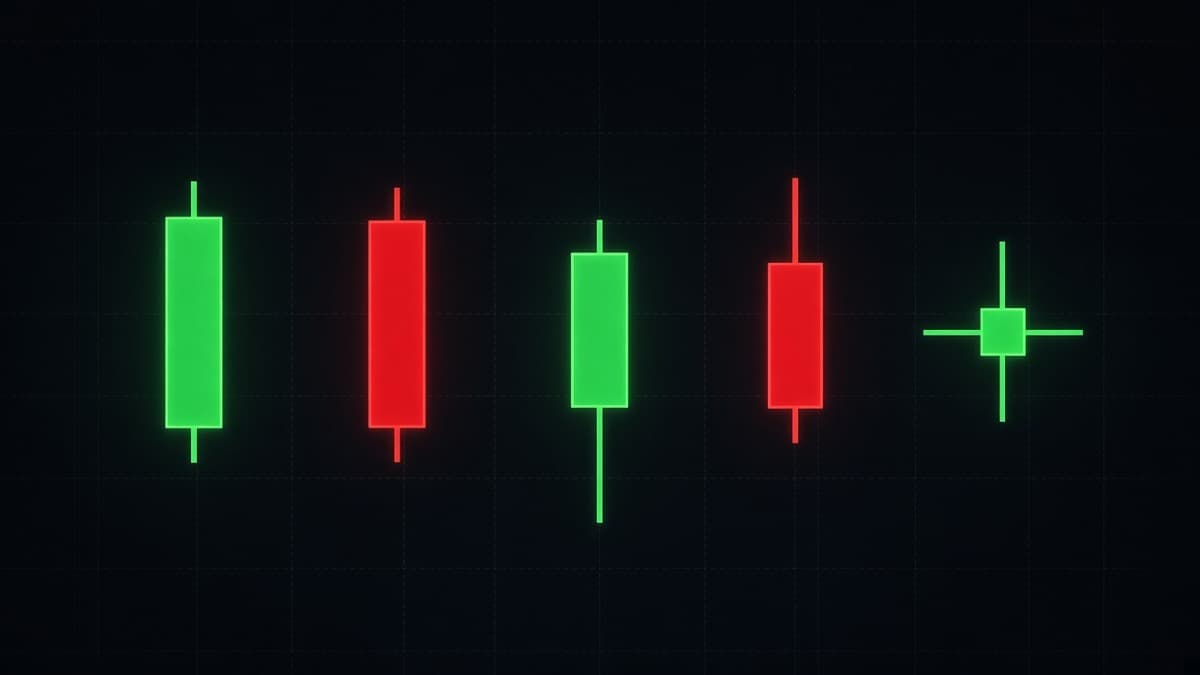
Then the body and its neighbours. Did the close take back the whole of the previous candle, the way the diagram above shows, or did it just drift a few pips up in a series of overlapping bars?
Now score the call. If the answer is "level, long lower wick, body reclaiming the last red candle", the UP direction has a visible reason and you can take it as a second opinion on something you can see yourself. If the answer is "middle of a flat range, three doji in a row", the direction may still win, and it won for reasons neither you nor the tool can point at. Ten of those, written down, tell you what you have.
This is also the honest way to test REDBERRY. The desk shows the pair and the 1m window on screen, so the candle in question is never ambiguous, and you can hold each call against your own chart the same way.
Japanese Bot vs Redberry AI Bot, criterion by criterion
| Criterion | Japanese Bot | Redberry AI Bot |
|---|---|---|
| Documented price source | None I can find | TradingView API for Live, private Quotex API for OTC |
| Can you trace a call to a candle | Unknown, ask the supplier | Pair and window are fixed and shown on the desk, so the bar is identifiable |
| Timeframe control | Unknown | Live fixed at 1m, OTC from the platform list |
| Accuracy language | Unknown | Stated as not 100 percent, with sizing rules to match |
| What it will not do | Unknown | No trades placed, no funds held, no broker login taken |
| Support | Unknown | contact@redberrybot.com, usually one to two working days |
Six rows, four of them unknown on the left. I would rather leave those blank than fill them with guesses, and you should treat any review that fills them confidently with the same suspicion.
Which one fits which trader
If you already read candles well, what you want from any tool is a second opinion that arrives fast enough to act on, and a source you can reconcile with your own chart. That is a reasonable thing to want from either column. Test with the ten call exercise above.
If you are newer, the risk with a branded bot is subtler than being wrong. It is never learning why. A direction with no visible reason teaches you nothing across a hundred trades, and you end up with a hundred trades of experience you cannot use. Pair any tool with the structure guides: smart money concepts for levels and liquidity, and the candlestick guide above for the bars themselves.
If you want the desk that names its feed and prints its rules before you start, that is what REDBERRY is for. About us sets out what it is not: not a broker, not a fund manager, no money held, no trades placed on your behalf.
Starting on the desk
Choose Quotex, register through the button on that platform's card, deposit at least $100 in a Live account, then enter your Trader ID. Quotex shows an 8 digit ID under your email when you tap the balance. The key is 16 characters.
Before the desk opens you get three rules, and they are the part most signal tools never mention. Take signals on a Live account rather than the broker's demo, because the two behave differently. Risk 1 to 2 percent per signal. Use one step of MTG and no more. Then you report each result as WIN, LOSS or REFUND with the amount, which builds the log this whole article has been asking you to keep.
If you want the same question approached from the timeframe side, Irani Bot vs Redberry AI Bot covers what a direction without a window is worth, and Meeru Bot vs Redberry AI Bot deals with accuracy claims and how to measure one honestly.
Questions people ask
Does Japanese Bot actually use Japanese candlestick analysis?
I cannot tell you, and that is the honest answer. Candlestick charting did come from Japanese rice markets, so the name borrows real history, but a name is not a method. Ask whoever supplies the tool which candle a call was read from and on which timeframe. If nobody can answer, the candlestick part is branding.
Is Japanese Bot better than reading candles myself?
Reading candles yourself has one advantage no tool can match: you know exactly why you entered, so a loss teaches you something. Any tool, including Redberry, should be treated as a second opinion on structure you can also see. If a call makes no sense against the chart in front of you, skip it.
What does Redberry AI Bot read before it prints a direction?
On Live pairs it takes realtime price and chart structure from the TradingView API across 17 FX pairs, then inbuilt strategies predict the next move on a fixed 1m window. On OTC it reads a live price feed from private Quotex API access, with the same strategies. You pick the pair, and on OTC the timeframe too.
Can a candlestick pattern make a signal reliable?
No. A clean engulfing candle at support is a good reason to expect a bounce and it still fails often enough to matter. That is why position sizing exists. Redberry states that signals are not 100 percent accurate, and the desk rules assume losing trades rather than pretending they are rare.
Which pairs and timeframes does each one cover?
For Japanese Bot I have no documented list, so it depends on the build you were given. Redberry covers 17 FX pairs on the Live tab at 1m only, and the Quotex OTC lists on the other tabs: 5s to 4h.
Nothing here is financial advice. Signals and setups can be wrong, so only risk money whose loss will not change your life.