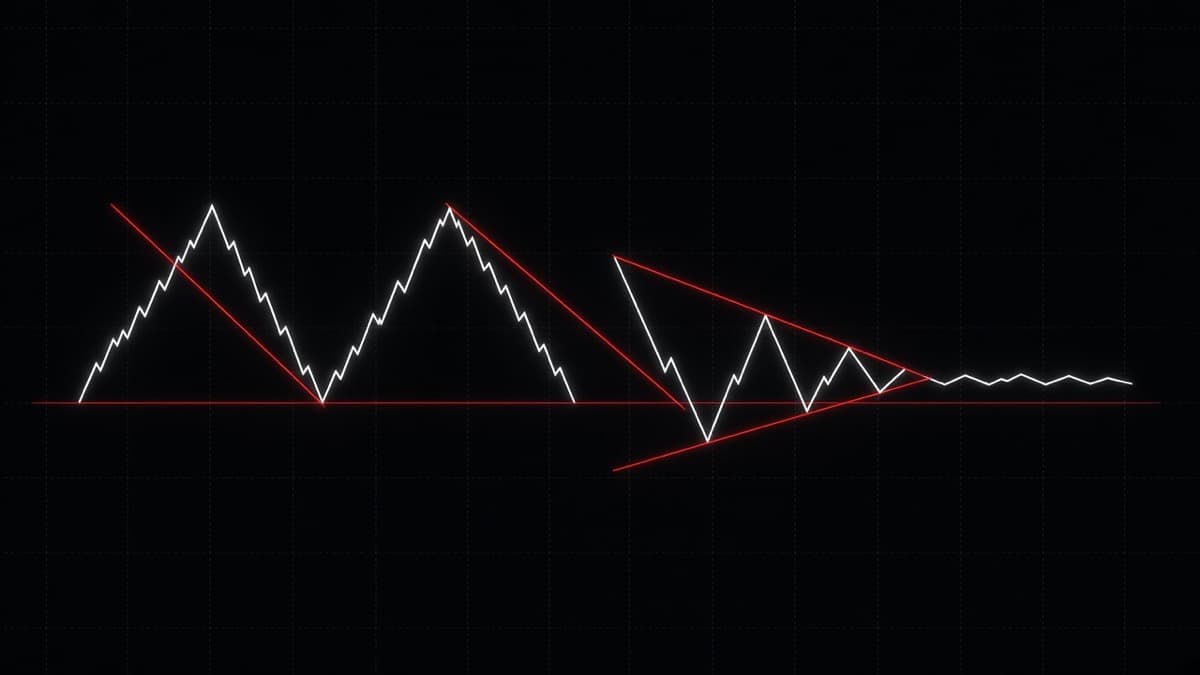
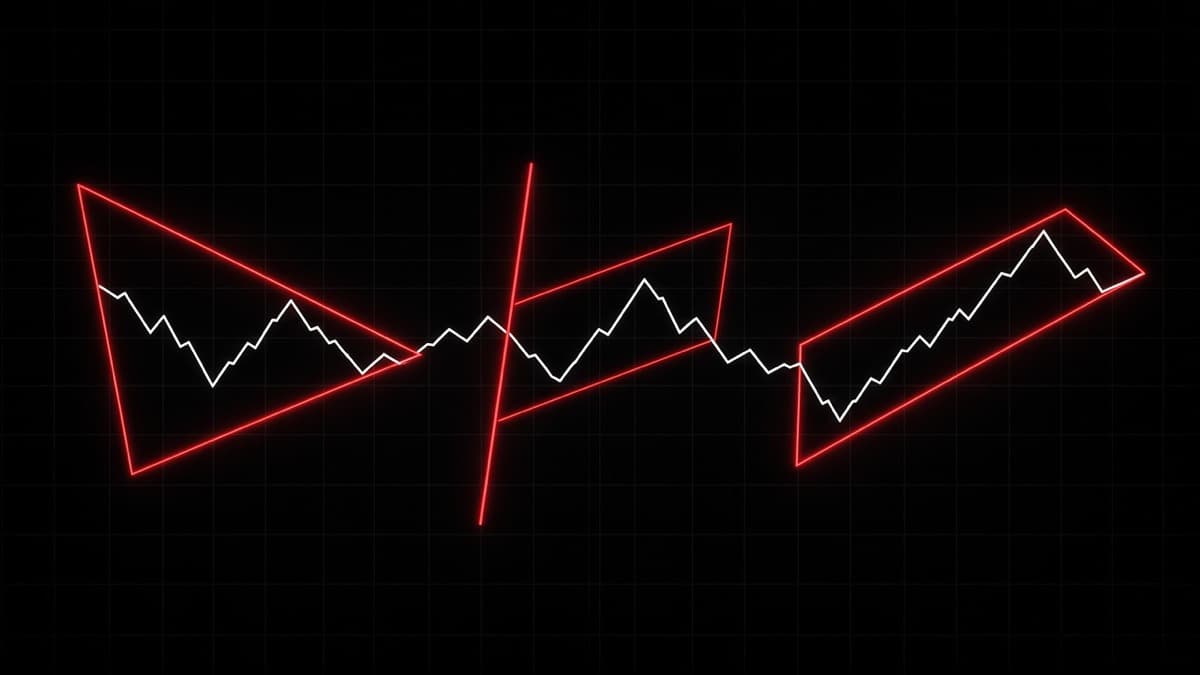
Head and Shoulders Pattern: How to Trade It
Head and shoulders explained by a trader: drawing the neckline, sloping necklines, the inverse pattern, measured targets, retests and what invalidates it.
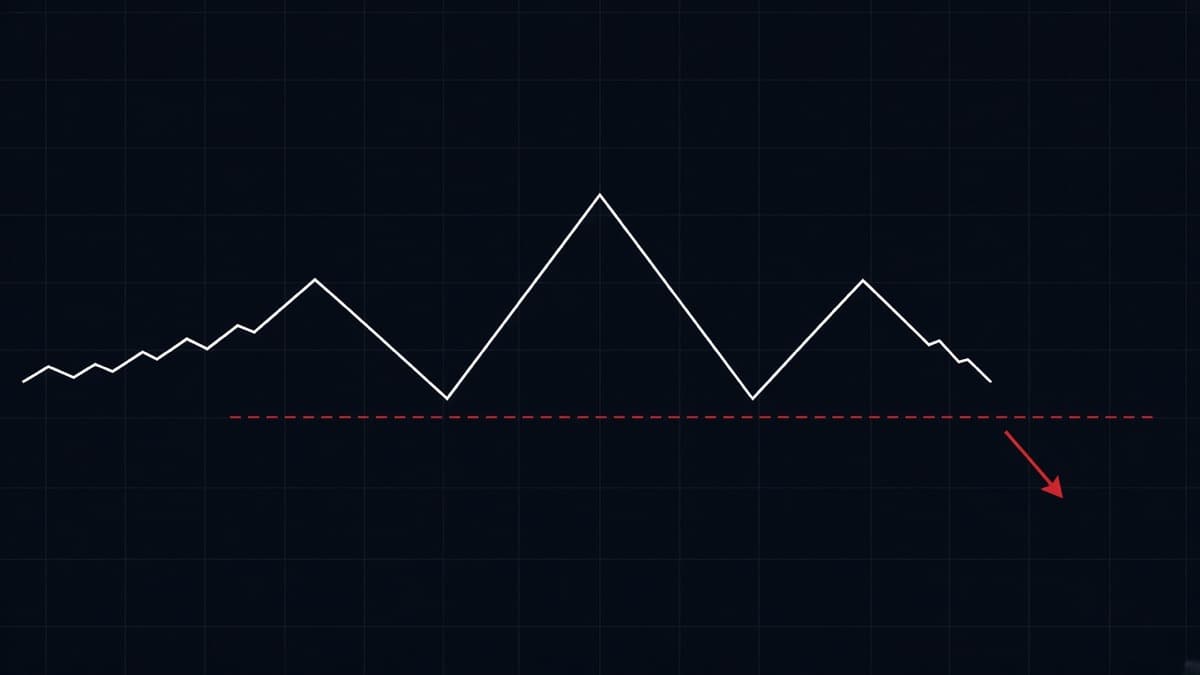
A head and shoulders is three attempts in the same direction where the middle one goes furthest and the third one gives up early. The neckline under the two pullback lows is the trade. Nothing happens until it breaks.
The pattern gets a lot of attention because it looks dramatic on a finished chart. In real time it is much less obvious, because while the right shoulder is forming you cannot know whether it is a right shoulder or the start of another leg up. That uncertainty is the whole problem, and the way around it is to trade the line rather than the shape.
This piece covers what each of the three pushes tells you, how to draw a neckline that is flat and one that slopes, the inverse version, the measured target arithmetic, the retest entry, and the two ways the pattern gets invalidated. It sits under the chart patterns complete guide.
What is the head and shoulders pattern?
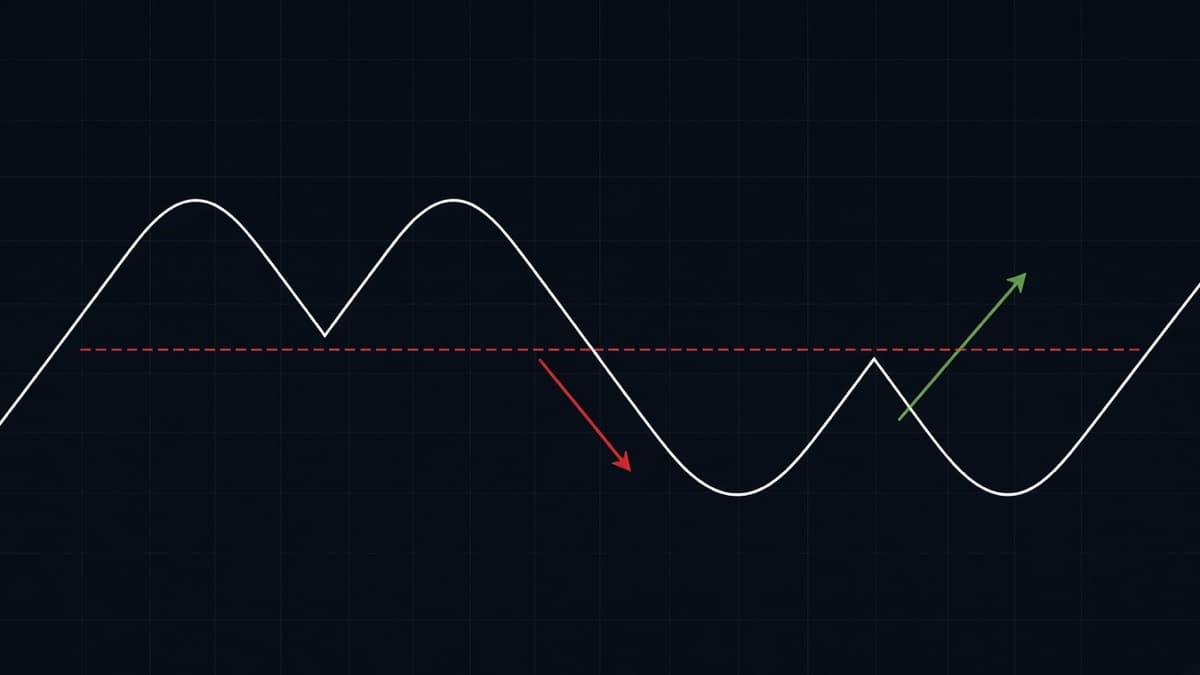
On a top: price makes a high, pulls back, makes a higher high, pulls back, then makes a third high that stops around the level of the first one. The first high is the left shoulder, the middle one is the head, the third is the right shoulder. The two pullback lows form the neckline.
The order flow story is simple. Buyers pushed price to a new high at the head. On the next attempt they could not get there, which means either the buyers are out of size or sellers have arrived in bigger amounts. Either way, the last defended level is the pullback low after the head. When that goes, the traders who bought into the right shoulder are underwater with nothing above them to sell into, and their exits become the first leg down.
That is why the pattern is a reversal. Not because the shape resembles a body, but because a market that cannot make a new high and then breaks its last support has changed hands.
What each of the three pushes tells you
Left shoulder. Just a swing high in an uptrend. On its own it means nothing. You only label it later, after the head and the right shoulder exist.
Head. The last new high. This is where the trend achieved something and where the largest positions often changed hands. Where you have reliable volume, the head frequently carries the heaviest activity of the three.
Right shoulder. The informative one. Its height tells you how much strength is left. A right shoulder that stops well below the left shoulder is weak, and the break tends to be quick. A right shoulder that pushes almost to the head is a close fight, and those patterns fail more often, because buyers are still able to get price most of the way back.
Symmetry is a nice-to-have, not a rule. Textbook drawings show two shoulders at the same height with matching widths. Real charts give you a right shoulder that is lower and faster, or higher and slower. What you need is only this: the middle push is the highest, and the third push fails before reaching it.
How to draw the neckline
Connect the pullback low after the left shoulder to the pullback low after the head. That line, extended to the right, is your neckline.
Details that matter:
- Use the swing extremes, not a line that looks tidy through candle bodies. If the low after the head is 1.2648, the neckline passes through 1.2648.
- Extend it before the right shoulder finishes. You want the line drawn and waiting, so when price reaches it you are reading behaviour instead of drawing.
- Treat it as a band on fast charts. On 1m, allow a small tolerance either side. Spread and feed noise will cross a hairline level without meaning anything.
- One line, not two. If the two lows are at very different prices, you have a sloping neckline, which is handled below, not two separate levels.
A flat neckline is the easiest case and the one most traders can see, which makes it more useful precisely because it is obvious. Everyone's stops and entries cluster in the same place.
What if the neckline slopes?
Often it does. The second pullback low can sit below the first, which gives a downward sloping neckline on a topping pattern.
A down-sloping neckline on a top is a sign of weakness developing early: the market could not even hold the previous pullback low before the right shoulder formed. It also means the break happens at a lower price than a flat neckline would, so the entry is later and the measured target sits further away.
An up-sloping neckline on a top is the opposite: the second low is higher than the first, so buyers were still stepping in earlier each time. The break comes at a higher price, which gets you in sooner, but it is a less convincing signal, because the pattern has not yet shown real weakness at the lows.
Two practical notes. Extend the sloping line to the right and judge the break against the line value at that bar, not against a fixed price. And do not let a steep slope talk you into a pattern: if you need a 45 degree neckline to make the shape work, you are probably looking at a channel, not a head and shoulders.
The inverse head and shoulders
The same structure at a bottom. A left shoulder low, a deeper head low, a right shoulder at roughly the left shoulder depth, and a neckline across the two bounce highs.
Read it the same way. Sellers drove price to a new low at the head. On the next attempt they could not get back there. The last level sellers defended is the bounce high after the head, and when price closes above it, the shorts who sold the right shoulder are trapped.
One difference worth knowing: bottoms tend to take longer than tops. A selloff is driven by urgency, and the recovery is usually built out of slower buying. So an inverse pattern on USD/CHF 15m can spend a long time between the right shoulder and the neckline break. That waiting period is where impatient traders enter early and then get shaken out by one more dip.
Reading the right shoulder while it forms
This is the part of the pattern you can actually work with in real time, so it is worth being deliberate about it.
While the third push is developing you do not know what it is. What you can measure is where it is struggling. Mark the head's high and the left shoulder's high on the chart. If the current push rolls over between those two levels, the pattern is building as expected. If it stalls well below the left shoulder, sellers are getting in earlier than last time, which is stronger for the eventual break. If it grinds up past the left shoulder and keeps going, prepare to drop the idea.
Watch the speed too. A right shoulder that takes twice as many bars to cover half the distance of the left shoulder is a slow-motion failure, and that is the healthiest version of the pattern. A right shoulder that rips up fast is a warning: momentum is still there and the head may not hold.
The other thing to watch is what price does with the neckline on the way down from the right shoulder. If it slices into the line with full-bodied candles, the break is likely. If it arrives with small bodies and long lower wicks, buyers are absorbing at the level and you should expect at least one more bounce before anything breaks.
None of this is an entry. It is preparation, so that when the neckline does break you already know whether you want the trade.
Entry: break, retest or second leg
Three ways in, and each one trades earliness against reliability.
On the break. Enter when a candle closes through the neckline. Earliest, most failures, and the only realistic option on fast charts where the retest often never comes.
On the retest. Wait for price to come back into the neckline from the other side and fail there.
The retest gives you a tighter invalidation, because you now know the exact price that kills the trade: a close back through the neckline. It also gives a better entry price, which matters more on spot than on binary. The cost is missed trades, since strong breaks frequently run without looking back.
The inverse pattern gives you the same option in reverse. Price breaks above the neckline, drops back to it, holds, and continues.
On the second leg. Skip the neckline event entirely and wait for the first lower high after the break on a top, or the first higher low after the break on an inverse. Slowest entry, and it filters out most of the fakeouts.
Whichever you choose, use the candles at the line as your trigger rather than the line alone. A long upper wick rejecting the neckline on a retest is a much better signal than a doji that leaves the question open.
The measured target
Measure vertically from the top of the head to the neckline, then project that same distance from the break point.
Worked example on GBP/USD 1h. The head prints at 1.2820. The neckline sits at 1.2720. The height is 100 pips. Price closes below 1.2720, so the measured target is 1.2620.
That number is a ruler, not a prediction. It tells you whether the trade is worth the risk: if the pair typically covers 30 pips in an hour and your target is 100 pips away, you are looking at several hours of work, not one candle. On binary, where you choose an expiry instead of a stop and a target, the measured move helps you decide whether a 1m or a 5m expiry is asking for something reasonable. More on sizing the expiry to the move in binary options expiry times explained.
Price commonly stops short of the projection near round numbers, because other traders are taking profit at 1.2650 or 1.2600 before your target. It sometimes overshoots when the break lands on a session open. Neither outcome makes the measuring rule wrong, because the rule was never a forecast.
Does volume confirm the pattern?
Where you have real volume, the classic reading is that the head carries more than the right shoulder. The market spent more effort making the final high than it did on the attempt that failed, which fits the story the shape is telling. A neckline break on volume that clearly stands out from the surrounding bars is a better break than one that looks like every other bar on the chart.
In retail FX and on binary platforms the volume you see is usually tick volume from a single feed. It counts price updates, not contracts, so treat it as a rough activity gauge rather than proof. It does rise around session opens and news, which makes it useful for one thing: telling you whether anyone is actually trading right now.
When volume is unreliable, use range and speed as a substitute. Compare the breakout candle against the previous twenty. If it is noticeably larger and closes near its extreme, it is behaving like a real break. If it is the same size as the drift that preceded it, expect a retest at best. Session timing is the other proxy, and it is a strong one: a neckline breaking in the first hour of London has weight behind it that the same level breaking during the pre-Tokyo lull does not.
How long should the pattern take?
There is no fixed number of bars, but the proportions matter.
The right shoulder should take a similar amount of time to the left, give or take. A right shoulder that drags on for three times as long as the left one is telling you price is not being rejected, it is being distributed slowly, and the eventual break tends to be weaker because there is no trapped crowd with urgent exits.
The gap between the right shoulder and the neckline break also matters. A pattern that completes within a few bars of the right shoulder high is behaving as the shape implies. A pattern where price hangs just above the neckline for thirty bars is decaying, and by the time it eventually breaks, most of the traders who were positioned for it have already left.
As a working rule on a 15m FX chart, a head and shoulders that takes three to six hours to build and breaks within an hour of the right shoulder is a normal, tradeable pattern. One that takes two days and then breaks on a Friday afternoon is a shape on a chart, not a setup.
What invalidates a head and shoulders?
Two things, and both are clean.
The right shoulder trades above the head. Then you do not have a pattern, you have an uptrend making a higher high.
This is the more common of the two, and it is why the pattern should not be traded before the neckline breaks. While the right shoulder is forming, the market has not decided. Traders who short the right shoulder in anticipation are betting on a shape that has not finished, and the cost of being wrong is the full run to the next high.
Price closes back above the neckline after the break. The break happened, sellers committed, and then it was taken back.
A failed break usually moves faster than the pattern would have. Everyone who shorted on confirmation has a stop just above the neckline or above the right shoulder, and those stops get taken in sequence. If you see this happen, the sensible response is to stop looking for the short entirely and consider whether the uptrend has simply resumed.
There is also a soft invalidation worth respecting: time. If the neckline has been sitting a few pips away for thirty bars with price drifting sideways against it, the pattern is decaying. The traders who were positioned around it have been stopped out or have closed, and the level no longer has the crowd behind it that made it worth trading.
Head and shoulders versus double top
They are neighbours, and on a 1m chart you will sometimes see one turn into the other.
A double top is two attempts at the same price. A head and shoulders is three attempts where the middle one went higher. If a double top makes a third push that fails below the first two highs, what you have now is closer to a head and shoulders with the head in the middle.
The practical difference is in the neckline. A double top has one pullback low between the highs, so one level. Head and shoulders has two pullback lows, which means the neckline can slope and the break can happen at a price that is not obvious. Head and shoulders also tends to be the larger pattern of the two, so the measured target is further away and the trade needs more time or a longer expiry.
If you are unsure which you are looking at, trade the line you can defend. Both patterns break at a pullback low, and if the lows are close together, the exact label does not change the trade.
Head and shoulders on 1m versus 1h
On 1h you get the version from the textbooks. Shoulders are clear, the neckline is one obvious level, the break is a single candle, and you have time to prepare. There are few of these in a week on any one pair.
On 1m the pattern shows up several times a session on a pair like GBP/JPY, and most of them are noise. The two pullback lows are often only a pip or two apart, so the neckline slope is meaningless. Wicks cross the line constantly. The shoulders may only be three or four candles wide, which is not enough structure to trap anybody.
| 1m | 1h | |
|---|---|---|
| Shoulders | a few candles each | many candles each |
| Neckline | needs a tolerance band | one clear level |
| False breaks | frequent | fewer |
| Patterns per session | several | rare |
| Best use | timing an entry | finding the setup |
The way to use both: find the pattern on 15m or 1h, mark the neckline, then drop to 1m and watch how price behaves when it arrives at that price. You get a level that many traders can see and a candle-level entry. What does not work is drawing a 1m head and shoulders inside a strong 1h uptrend and expecting a reversal from it.
On OTC pairs
OTC symbols have their own feed and their own book, so the chart is not a copy of the live pair. The pattern still forms, because the same order flow logic drives it, but the prices belong to the platform.
Draw the neckline on the OTC chart you are actually trading. Do not copy a level from the live EUR/USD chart onto EUR/USD OTC and expect it to matter. Favour structure from the current session, since an OTC level from hours ago carries less weight than one price tested recently. Platform naming and mechanics differ between brokers, which is covered in the Quotex trading guide.
Using it with a desk signal
REDBERRY is a non-profit informational signal desk. It is not a broker, it does not hold funds, and it does not place trades.
On live pairs it uses the TradingView API for realtime price and chart structure, then inbuilt strategies predict the next move. Live covers 17 FX pairs and the generate time is always 1 minute. On OTC it uses private Quotex API access for a live OTC price feed, with the same inbuilt strategies on the pair and timeframe you select.
Signals are not 100% accurate. Use one as a second opinion on a pattern you already drew. If your neckline on EUR/JPY has just broken and the desk call points the same way, you have two independent reads agreeing. If they conflict, skipping the trade is usually cheaper than picking a side. The build process is described in how REDBERRY generates live and OTC signals.
Checklist before you take the break
- Is the middle push clearly the highest, with the third push failing below it?
- Have I drawn the neckline through both pullback lows, extended to the right, before the break?
- Did price close through the neckline rather than wick through it?
- Is the measured target far enough away to be worth the expiry or the stop I am using?
- Do I know the two invalidation prices, the right shoulder high and the neckline?
- Is the session active, with no scheduled release inside my window?
- Is my size unchanged from the last trade, at the 1 to 2 percent the desk rules ask for, as covered in risk management for binary trading?
Mistakes that cost the most
Shorting the right shoulder. The shape looks complete to your eye before it is complete on the chart. Until the neckline goes, the trend is still the trend.
Forcing three pushes into the pattern. Any zigzag has three highs in it. If the middle one is not the highest, or the third one is above the head, there is no pattern.
Moving the neckline down a few pips after a failed break. Same error as moving a stop, and it is a psychology problem rather than a charting one. Trading psychology and discipline deals with the habit directly.
Trading a tiny pattern for a big target. A head and shoulders with 8 pips between the head and the neckline has an 8 pip target. After costs there is nothing there.
Ignoring the sweep. A poke above the right shoulder that closes straight back down is not automatic invalidation, it is often the stop run before the break. Judge it on closes, as with any obvious level where stops are stacked.
Questions people ask
What is the head and shoulders pattern?
Three pushes in the same direction where the middle one goes furthest. On a top you get a high, a higher high, then a third high that stops near the first one. The two pullback lows between them form the neckline, and the pattern completes when price closes through that neckline.
How do you draw the neckline on a head and shoulders?
Connect the two pullback lows, the one after the left shoulder and the one after the head. If they sit at roughly the same price you get a flat neckline. If the second is lower or higher you get a sloping line, and the break is judged against the sloping line extended to the right.
What is the target of a head and shoulders pattern?
Measure vertically from the top of the head down to the neckline, then project that distance below the neckline from the break point. It is a drawing rule that tells you whether the trade has room. Price can stall well short of it or run past it.
What invalidates a head and shoulders?
A right shoulder that trades above the head, or a close back above the neckline after the break. If the third push exceeds the head, you have an uptrend making higher highs and no pattern at all.
Is an inverse head and shoulders bullish?
It marks a possible bottom, so the bias is up once the neckline breaks. The structure is a left shoulder low, a deeper head low, a right shoulder near the left shoulder depth, and a neckline across the two bounce highs. Until that neckline closes above, it is still a downtrend.
Does head and shoulders work on 1 minute charts?
The shape appears, but the edges are untidy and false breaks are common. A better approach on fast charts is to find the pattern on 15m or 1h, mark the neckline, then drop to 1m to time the entry at that level.
Nothing here is financial advice. Signals and setups can be wrong, so only risk money whose loss will not change your life.