Triangles, Flags and Wedges: Continuation Patterns
Ascending, descending and symmetrical triangles, bull and bear flags, wedges and pennants, plus how to tell a real squeeze from chop before you take the break.
Continuation patterns are pauses. Price makes a move, rests, and then carries on in the same direction. Triangles, flags, pennants and wedges are four ways that rest looks on a chart, and in every case the trade is the trendline, not the shape.
The reason this group matters more than the reversal patterns for short-term traders is frequency. You will see several flags in one London session on GBP/USD. You will see a proper head and shoulders far less often. The cost of that frequency is that most of what looks like a squeeze is nothing at all, so a large part of this article is about telling the difference.
This sits under the chart patterns complete guide, which covers the reversal side and the general rules.
What all continuation patterns have in common
Three things, and if any one is missing you should be suspicious.
A leg in. There must be a clear directional move before the pattern. That leg is the information. It tells you which side is in control and which way the break is likely to go. A pattern with no leg into it is just a range.
A contraction. Inside the pattern, price must be doing less than it was. Smaller swings, smaller candles, narrower range. Contraction is the mechanism: it means the market has stopped fighting and is waiting.
A line that has been touched at least twice. The breakout level. Without it you cannot say where the pattern ends, and you cannot define the invalidation.
When all three exist, the trade is mechanical: wait for the close beyond the line, know where the idea dies, size it the same as every other trade. When one is missing, you are usually about to trade chop.
Ascending triangle
Flat highs, rising lows. Price keeps getting rejected at one price while buyers pay more each time to get in underneath.
That combination is the reason the break usually goes up. The flat level is where a seller is working an order at a fixed price. Every time price pulls back it does so less, which tells you buyers are getting more urgent. Eventually the seller's order gets filled and there is nothing left above.
How to trade it. The flat level is your line, not the rising trendline. Wait for a candle to close above the flat highs. The invalidation is a close below the rising lows, and that price moves up as the pattern develops, which is convenient: your risk shrinks as the pattern matures.
One thing to check before taking it: how many times has the flat level been tested? Two touches is thin. Three or four means a real order sitting there, and a real cluster of stops above it. That cluster is why the first push after the break is usually the fastest part.
Descending triangle
The mirror image. Falling highs, flat lows. Sellers accept a lower price each time while buyers keep defending one level.
The flat lows are the line. The break is a close below them. The invalidation is a close above the falling trendline.
Descending triangles show up on FX when a pair grinds down into a round number that has been holding for hours, say USD/JPY sitting on 148.00 while each bounce peaks lower. The longer that goes on, the more stops build below the level, and the bigger the initial move when it goes. Be aware of the flip side: an obvious flat level with obvious stops under it is exactly the kind of price that gets swept before a reversal, so judge the break on the close and not on the first spike.
Symmetrical triangle
Lower highs and higher lows converging into an apex. Both sides are giving ground.
This pattern has no directional information of its own. It tells you volatility is contracting and that a move is being loaded. Direction has to come from somewhere else: the trend the triangle sits inside, the higher timeframe structure, or a session open that tends to pick a side.
Two practical rules for symmetrical triangles.
First, do not take the break too close to the apex. Near the apex the two lines are a pip apart and everything is a break. The best breaks happen in the middle third of the pattern, where there is still room between the lines and the break actually has to cover distance.
Second, if you cannot name the trend that the triangle sits inside, pass. Trading a symmetrical triangle with no directional context is a coin flip with a spread attached, and there will be another setup in twenty minutes.
Bull flag
A steep move up, then a shallow drift lower inside two roughly parallel lines, then continuation.
Flags are the most common continuation pattern on fast charts and the easiest to grade, because the quality test is just two numbers: how deep and how long.
Depth. A good bull flag gives back a small part of the pole. If price retraces most of the leg it just made, that is not a pause, that is a fight, and the next move is genuinely unclear. As a working guide, a flag that holds above the upper half of the pole is healthy. One that slides back to the pole's start is not a flag any more.
Time. A good flag takes fewer bars than the pole did, or roughly the same. Once the flag takes three times as long as the pole, the momentum that created it has drained away and the breakout has nothing pushing it.
Entry is the close above the flag's upper line. Invalidation is a close below the flag's lower line, which is usually only a few pips away, and that tightness is why flags are attractive for short binary expiries.
Bear flag
The same structure in a downtrend. A sharp drop forms the pole, then price drifts slightly higher inside a narrow channel before the move continues.
Bear flags are often tighter and faster than bull flags, because the move that created them was driven by urgency. The drift up is traders taking profit rather than new buyers arriving. That is why the drift should be shallow and slightly upward, not a full recovery.
Watch out for one thing: a bear flag that turns into a wider channel and starts making higher highs on the timeframe above yours is not a flag, it is the start of a reversal. Draw both lines, and if price breaks the upper one convincingly, drop the idea rather than waiting for it to come back.
Pennants
A flag with converging lines instead of parallel ones. A steep pole, then a handful of bars pinching into a small cone, then continuation.
Pennants are short by definition, and that is the whole test. If your cone spans forty bars, it is a symmetrical triangle and it has lost the pole's momentum. A real pennant is five to fifteen bars of compression directly after a fast leg, and it usually resolves in the direction of that leg.
The best pennants appear right after news or a session open, when a pair moves a long way in a few minutes and then goes quiet while the market digests it. That quiet period is the pennant. The break out of it is often the second half of the same move.
Rising wedge
Both boundaries slope up and converge, because the lows rise faster than the highs.
Read it like this: price is still making higher highs, but each one is a smaller achievement than the last, and the pullbacks are getting shallower because buyers are chasing. That is what running out of steam looks like on a chart. Rising wedges usually resolve downward.
Two places you will find them. At the end of a rally, where the wedge marks the last push before a reversal. And inside a downtrend as a pullback, where the wedge is the recovery and the break down is the continuation of the larger move. The second version is the higher quality trade, because the wedge and the trend agree.
The line to trade is the lower boundary. Invalidation is a close above the upper line. Do not short inside the wedge just because the shape is there, since price can grind up inside one of these for far longer than looks reasonable.
Falling wedge
Both boundaries slope down and converge, with the highs falling faster than the lows.
Price is still technically declining, but the selling is getting weaker each time. The lows barely move while the highs keep coming down, which compresses the range until something has to give. Falling wedges usually resolve upward.
Like the rising version, the falling wedge is best when it agrees with the trend above it: inside an uptrend, a falling wedge is a pullback and the break up is continuation. At the end of a long downtrend it can mark a bottom, and it is worth cross-checking that case against the inverse pattern in head and shoulders, because the two often describe the same turn.
The line to trade is the upper boundary. Invalidation is a close below the lower one.
How do you tell a real squeeze from noise?
This is the question that decides whether continuation patterns make you money or cost you money.
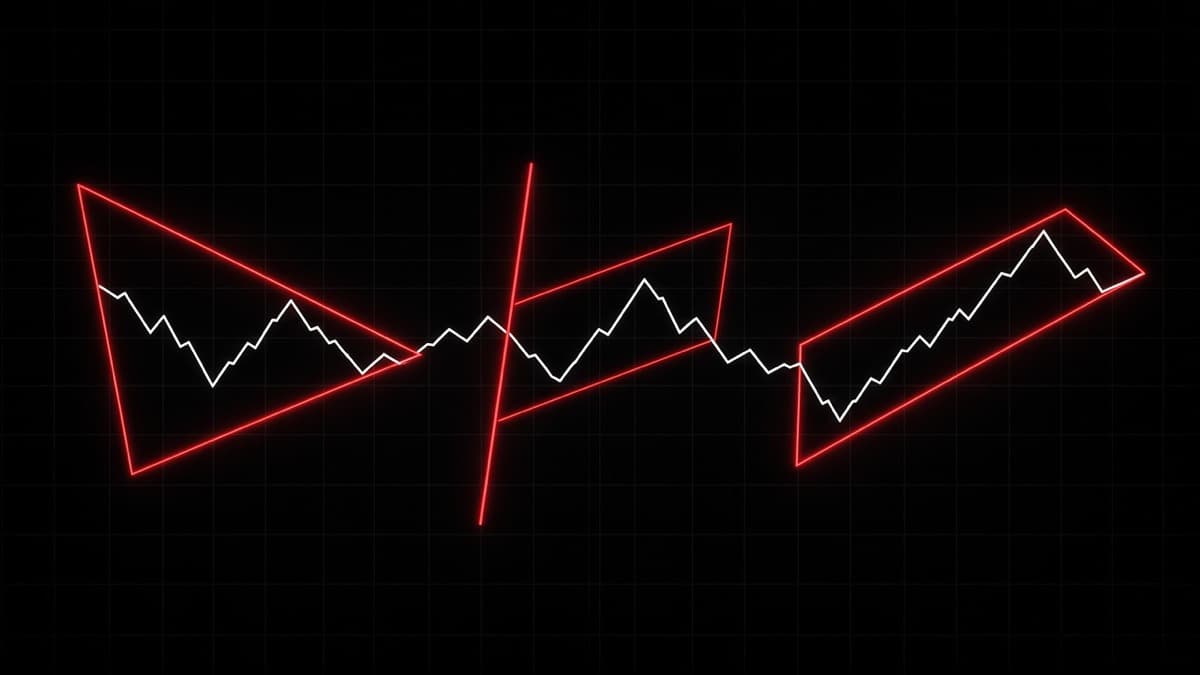
The chart above has lines on it, and it has a shape. It is still nothing, because the swings are not getting smaller. Price is covering the same distance in each direction at the end as it was at the start. That is a wide range, not a squeeze, and a break of a line drawn on it means nothing.
Four tests. Run them in order and most bad setups disappear.
- Are the swings shrinking? Measure the first swing inside the pattern and the last one. If the last is not clearly smaller, there is no contraction.
- Does each line have at least two real touches? A touch is a swing high or low that price turned at, not a candle that happened to graze the line.
- Is there a leg in? Continuation requires something to continue. Find the impulsive move before the pattern or move on.
- Is the pattern proportionate to the leg? A three-bar pause after a fifty-bar rally is not a flag, it is a breather. A forty-bar triangle after a five-bar move is not continuation, it is a new range.
One more filter that is not about drawing: time of day. A squeeze that forms in the quiet hours and breaks in the quiet hours has nothing behind it. The same shape resolving at the London open has real participation. Forex pairs and trading sessions sets out when each pair actually moves.
Break entry or retest entry?
Continuation patterns give you both options, and the right answer depends on the pattern's size.
On a flag or a pennant, take the break. The pattern is tight, so the invalidation is only a few pips below your entry, and the whole point of these shapes is that the move continues quickly. Waiting for a retest on a 1m flag usually means watching the move leave without you, because the flag was the pullback.
On a triangle, especially on 15m and above, the retest is often worth waiting for. The break of a flat level in an ascending triangle frequently comes back to that level, and the level then acts as support. You get a better price, and the invalidation becomes very clear: a close back below the flat level. The trade-off is the same as everywhere, some breaks never come back.
On a wedge, be careful with both. Wedge boundaries are sloping and converging, so the retest price changes with every bar and the level is less obvious to other traders. Prefer the close through the line plus a structural confirmation, such as the first lower high after a rising wedge breaks down.
One rule that applies to all three: do not enter mid-pattern because you think you know the direction. Inside a triangle, price can touch both lines three more times before it resolves, and each of those touches will look like the start of a break while it is happening.
Rectangles and channels
Two more pauses that get mistaken for triangles.
A rectangle is a flat-topped, flat-bottomed range. Price rotates between the same two levels with no contraction at all. After a strong leg it usually behaves as continuation, so the break in the direction of that leg is the higher probability trade. The difference from a triangle is that there is no squeeze, which means the timing is unknown and a rectangle can last a long time. While it lasts, its two levels are useful even if the break never comes, because you can fade the edges while they hold.
A channel is a rectangle on a slope. Both lines are parallel and sloping, and price walks between them. A channel that slopes against the larger trend is effectively a large flag, and it resolves the same way: the break of the channel line in the direction of the trend is the continuation trade. A channel that slopes with the trend is just the trend, and trading the break of its lower line is fighting it.
The mistake to avoid is treating a channel as a wedge. In a channel the lines are parallel and the range stays constant. In a wedge they converge. That difference changes the expected resolution, so measure the first and last swing before you label it.
Measuring the target
Each pattern has a measuring rule, and all of them are arithmetic rather than forecast.
- Flag or pennant: the height of the pole, added to the breakout level.
- Triangle: the widest part of the triangle, projected from the breakout point.
- Wedge: the widest part of the wedge, projected from the break, which is usually the least reliable of the three.
- Rectangle: the height of the range, projected from the breakout level.
Worked example. EUR/USD runs from 1.0840 to 1.0880, a 40 pip pole. It then drifts down to 1.0868 in a tight flag. Price closes above 1.0876, the flag's upper line, so the measured target is 1.0916.
The value of that number is deciding whether the trade is worth taking, and whether the expiry you are about to pick is realistic. If the target is 40 pips away and the pair is covering 3 pips a minute, a 1m expiry is not asking for the target, it is asking for the next push. Sizing the expiry to the move is the whole subject of binary options expiry times explained.
Flags frequently deliver part of the projection and stop. Triangles sometimes run double it when the break catches a session open. Neither result makes the rule wrong, because the rule is a ruler.
Breakouts that fail
Continuation patterns fail in a specific, recognisable way, and knowing it is worth more than knowing two more pattern names.
The sequence: price closes above the level, everyone waiting for confirmation enters, and then it comes straight back inside. Those buyers now have stops under the rising trendline. When price gets there, their exits accelerate the move down, which is why a failed ascending triangle often produces a faster decline than the pattern would have produced a rally.
The flag version is the same story on a smaller scale. The break happens, one push follows, and then price gives all of it back and closes under the flag. At that point the continuation idea is dead, and holding on because the shape was textbook is how a small loss becomes a large one.
Why these fail:
- No real contraction. The pattern was a range and the break was just another rotation.
- The leg in was already exhausted. The flag came after the fifth push of a move, not the first.
- Dead session. The break happened when nobody was trading the pair.
- The level was obvious and thinly defended. An easy flat level with visible stops beyond it is a target, not a wall.
The useful response is the same as with reversal patterns. Take the invalidation when it prints, and consider that the failure itself is a signal: a failed bull flag that closes below its lows often becomes the first leg of a move down. That does not mean reverse immediately. It means stop looking for longs.
Timeframes: what changes between 1m and 1h
Flags and pennants translate well down to 1m, because they are small patterns by nature and they form inside fast moves. A 1m bull flag after a sharp push at the London open is a real pattern with real participation behind it.
Triangles translate badly. A large triangle on 1m is usually just consolidation, and the lines you draw on it are cosmetic. The swings inside are only a few pips, so the touches are noise rather than decisions. Wedges are in between: they need enough swings to establish converging lines, which is hard to do cleanly on 1m.
| Pattern | 1m | 15m | 1h |
|---|---|---|---|
| Bull or bear flag | works | works | works |
| Pennant | works | works | rare |
| Symmetrical triangle | mostly noise | works | works |
| Ascending or descending triangle | needs care | works | works |
| Wedge | hard to draw | works | works |
The reliable approach on fast charts is the same one that works for reversals. Find the pattern and the line on 5m or 15m, then drop to 1m to time the entry and see how price behaves at the level. You get a line other traders can see and a precise entry.
On OTC pairs
OTC symbols run their own feed and their own book, so the chart is the platform's, not the interbank market's. Continuation patterns still appear, because the same behaviour drives them, but two adjustments are worth making.
Draw your trendlines on the OTC chart you are trading. A flag boundary from live EUR/USD does not transfer to EUR/USD OTC. And prefer recent structure, because a triangle that formed hours ago has less weight than a flag that formed in the last ten minutes. OTC price action can also be smoother between levels, which makes small flags look cleaner than they are, so keep the contraction test honest.
Quotex shows OTC pairs as EUR/USD (OTC). The Quotex trading guide covers the lists.
Using a desk signal with a squeeze
REDBERRY is a non-profit informational signal desk, not a broker. It does not place trades and it does not manage funds.
On live pairs it uses the TradingView API for realtime price and chart structure, then inbuilt strategies predict the next move. Live covers 17 FX pairs and the generate time is always 1 minute. On OTC it uses private Quotex API access for a live OTC price feed, with the same inbuilt strategies on the pair and timeframe you choose.
Signals are not 100% accurate. The place where a desk call is genuinely useful is a symmetrical triangle, because that pattern has no direction of its own. If you have a clean squeeze on AUD/JPY and no view on which way it breaks, a desk call gives you one input you did not have. It is still an input, not an instruction, and the pattern's own invalidation line stays in charge of the trade. See how REDBERRY generates live and OTC signals for what goes into the call.
Checklist before you take a continuation break
- Is there a clear leg into the pattern, and am I trading in that direction?
- Are the swings inside the pattern getting smaller, not just moving sideways?
- Does the line I am trading have at least two real touches?
- Did price close beyond the line?
- Am I taking the break in the middle of the pattern rather than at the apex?
- Is the measured target far enough away to justify the expiry I am choosing?
- Do I know the exact price that kills the idea, and is my size unchanged at 1 to 2 percent, as in risk management for binary trading?
Mistakes that cost the most
Drawing lines until something appears. If you need three attempts to make the triangle fit, there is no triangle. This is the single most expensive habit in continuation trading.
Trading the apex. At the point of the triangle every candle breaks a line. Take the break while the pattern still has width.
Treating a deep flag as a flag. A pullback that gives back the whole pole is a reversal in progress, not a pause.
Shorting inside a rising wedge. The shape is a warning, the break is the signal. Wedges can grind for a long time before they resolve.
Taking every 1m squeeze. Volume of setups is not an edge. Most 1m consolidations are noise, and trading all of them guarantees you trade the bad ones. This and its relatives are collected in common binary trading mistakes.
Ignoring what the failure tells you. A continuation pattern that fails through its own invalidation line has just told you the control has changed hands. That is information, and the cheapest way to use it is to stop trading the old direction.
Questions people ask
What is the difference between a triangle and a wedge?
In a triangle the two boundaries slope in opposite directions or one is flat. In a wedge both boundaries slope the same way and converge, so price keeps making progress while the range gets smaller. That is why a rising wedge is a warning inside an uptrend rather than a continuation shape.
Which way does a symmetrical triangle break?
There is no built-in direction. A symmetrical triangle only tells you volatility is contracting. Use the trend it sits inside for the bias, and if you cannot identify a trend, skip it rather than guessing.
How do you measure a flag pattern target?
Take the height of the pole, the sharp move before the flag, and add it to the breakout level. It is a drawing rule that tells you whether there is room for the trade, not a prediction. Many flags deliver part of it and stop.
Is a rising wedge bullish or bearish?
It usually resolves downward, even though price is rising inside it. The lows rise faster than the highs, so each new high is a smaller achievement than the last. The signal is still the break of the lower line, not the shape on its own.
How do you tell a real squeeze from random chop?
A real squeeze has a measurably narrowing range, with each swing smaller than the one before, and each trendline touching at least twice at genuine swing points. Chop has a range that stays the same width and lines you had to force through single touches.
Do continuation patterns work on 1 minute charts?
Flags and pennants do, because they are short by nature and they form inside fast moves. Large triangles on 1m are usually just consolidation with lines drawn on it. If you trade 1m, find the pattern on 5m or 15m and use the lower chart to time the entry.
Nothing here is financial advice. Signals and setups can be wrong, so only risk money whose loss will not change your life.