Chart Patterns: A Complete Guide for Traders
Chart patterns explained the way traders use them: continuation versus reversal, where the neckline sits, measured targets, and how breakouts fail.
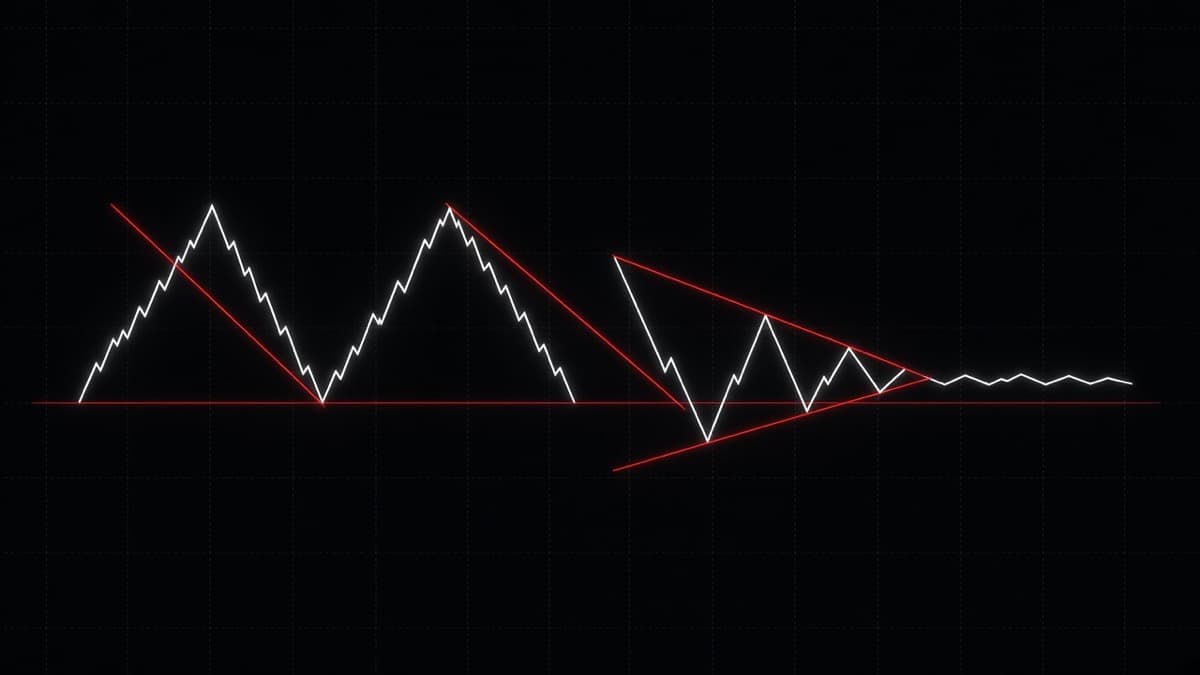
A chart pattern is a picture of where orders are stacked. The shape is only the packaging. What you actually trade is one line: the neckline under a double top, the flat resistance of an ascending triangle, the lower edge of a bear flag. Price closes through that line or it does not.
That is the whole idea, and most losing pattern trades come from forgetting it. Traders learn the shapes, spot one, and take the trade because the drawing looks right. The shape was never the signal. The line was.
This guide covers the patterns you will see on a real chart, how to draw the line that matters in each one, how to project a target from the pattern height, what volume adds when you have it, and what a failed pattern looks like before it costs you a position. For bar-by-bar reading, the companion piece is the candlestick patterns complete guide.
What is a chart pattern?
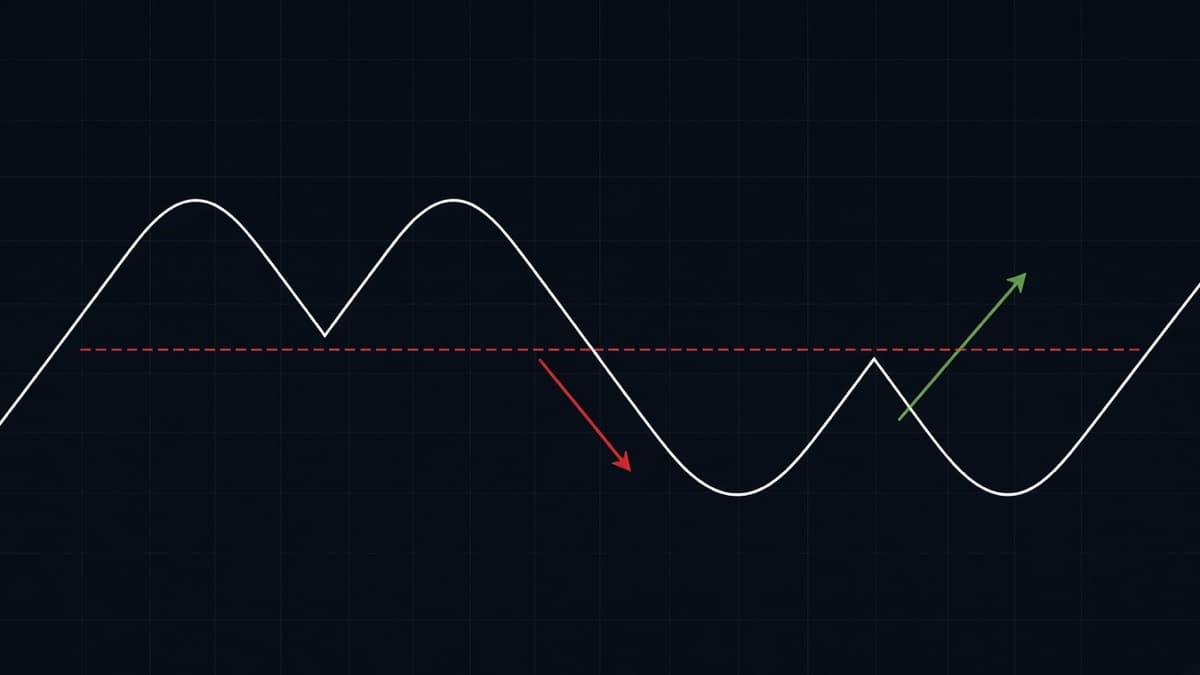
A chart pattern is a repeated arrangement of swing highs and swing lows that forms because traders keep doing the same thing at the same prices. Price runs to a level, sellers there take the offer, price falls back. Buyers who missed the first leg wait for a pullback and step in lower. Do that twice and you have drawn a double top. Do it with a deeper middle push and you have head and shoulders.
The shape is a side effect. The cause is orders resting at a price: stops above an old high, limit buys under a range low, a bank working a large position that cannot be filled in one go. Patterns are a way of reading where that resting business probably sits.
This is why the number of bars matters less than you think and the number of touches matters more. A level that has turned price away three times has real orders on it. A level drawn from one wick is a guess. When you look at any shape below, ask what makes the line valid before you ask what the shape is called.
Chart patterns are not the same thing as candlestick patterns. A hammer or shooting star covers one bar and tells you how that bar's fight ended. A chart pattern spans dozens of bars and marks a zone that many traders are watching at once. The useful combination is both: the pattern tells you which price to care about, the candle tells you whether the level is holding right now.
Continuation or reversal: sort every pattern into one of two boxes
Before naming anything, decide what the pattern is doing to the trend it sits inside. There are only two answers.
A continuation pattern is a pause. Price ran, then it rested, and the resting phase keeps the previous direction intact. Flags, pennants, most triangles and rectangles behave this way. The pause exists because the move went too far too fast and needs to shake out early profit takers before it can carry on. You trade it in the direction of the leg that came before the pattern.
A reversal pattern is a failure to continue. Price ran, tried again, and the second attempt could not make progress. Double tops, double bottoms, head and shoulders, triple tops and rounded bases belong here. You trade against the leg that came before the pattern, and you need a break of the level that was holding the trend together.
The same shape can be either, which trips up a lot of people. A symmetrical triangle inside a strong uptrend usually resolves upwards. The identical triangle at the top of an exhausted run can break down. A rectangle after a long rally is a pause. The same rectangle after a topping sequence is distribution. Context sets the bias, the pattern only sets the level.
Practical rule: look at the leg into the pattern. If it was one clean impulsive move, the pattern is probably a pause. If the leg in was slow, overlapping and already fighting for every pip, the pattern is more likely a top or a bottom. Market structure in the bars before the shape tells you more than the shape does.
The line is the trade, not the shape
Every pattern in this guide reduces to one of three lines.
- A horizontal level, which is a neckline, a range boundary or a flat triangle edge.
- A sloping trendline, which is the rising lows of an ascending triangle, the falling highs of a descending triangle, or either side of a wedge.
- A channel edge, which is what a flag actually is.
Draw the line first. If you cannot draw it with at least two clean touches, and ideally three, you do not have a pattern. You have a shape that your eyes made up.
A few rules that keep the lines honest:
- Use closes for horizontal levels when the chart is noisy and wicks when you want the extreme. Pick one method and stay with it so your levels stay comparable week to week.
- A neckline drawn from two pullback lows at 1.0840 and 1.0838 is one line at roughly 1.0839, not two. Patterns live in small bands, not at single prices.
- If your line needs to pass through the middle of three candle bodies to look neat, it is wrong. Move it to where price actually turned.
- Extend every line to the right before the break happens. A level you draw after the move is worthless.
The line also gives you the invalidation, which is the part beginners skip. In a double top the pattern is over when price trades back above the highs. In an ascending triangle it is over when price closes under the rising lows. Knowing that price makes position sizing possible, and on binary it tells you whether the expiry you were about to buy even makes sense.
How many touches make a level worth trading?
Two touches make a line. Three touches make a level. That distinction is worth money.
With two touches you have a hypothesis: price turned here twice, so orders may be resting here. With three you have evidence, because the market has now shown you twice in a row that it reacts at this price, and other traders have had time to notice and place their own orders there. This is why a triple top usually breaks harder than a double top. More people are committed to the level, so more of them are wrong when it goes.
There is a limit to this. Levels decay. A neckline that price respected six hours ago on USD/JPY 5m matters less than one from the last forty minutes, because the traders who were positioned around it have mostly been stopped out, filled or bored into closing. On fast charts, prefer structure from the current session. On 1h charts, a level can stay relevant for days, especially at obvious prices like 1.1000 or 150.00.
Quality also depends on how price reacted, not just how many times it touched. A level that produced a sharp rejection each time is stronger than a level price crept up to and sat on for ten bars. Sitting on a level is how a level gets absorbed. The longer price rests against it without being pushed away, the more likely the eventual move is straight through it.
One more thing about touches: count them on the timeframe you plan to trade. Zooming into 1m turns every level into a dozen touches because every small wick counts. That is not confirmation, it is resolution.
Reversal patterns: what they look like and where they break
Double top and double bottom
Two attempts at the same price, both rejected, then a break of the level between them. This is the simplest reversal pattern and the one you will see most often on 1m and 5m FX charts.
The two highs do not need to match to the pip. On GBP/JPY 1m they rarely will. What matters is that the second push fails to make real progress past the first, and that the pullback low between them is a level several traders can see. Once price closes below that low, the buyers who bought both highs are trapped, and their exits are the fuel for the next leg.
Double bottoms work the same way upside down. Two lows in a band, one bounce high between them, then a close above that high. The full mechanics, including retests, sweeps of the first high, and how the pattern looks on fast charts, are in double top and double bottom.
Triple top and triple bottom
Three touches instead of two. The extra test usually means the level is stronger and the eventual break is cleaner, because more traders have been forced to pick a side.
There is a trap here. The longer price hangs under a level, the more stops build above it, and the more attractive a sweep of that level becomes. A triple top that gets poked by one long wick and then reverses is normal behaviour, not an invalidation. What invalidates it is a close above the highs that holds. This is the overlap between classic patterns and liquidity sweeps, and it is worth knowing both languages for the same event.
Triple bottoms are the mirror image: three lows in the same band, two bounce highs, one neckline across them, and a close above that neckline to finish the pattern. They show up on FX during long consolidations, often when a pair has been grinding against a round number like 1.2500 for a whole session.
Head and shoulders and the inverse
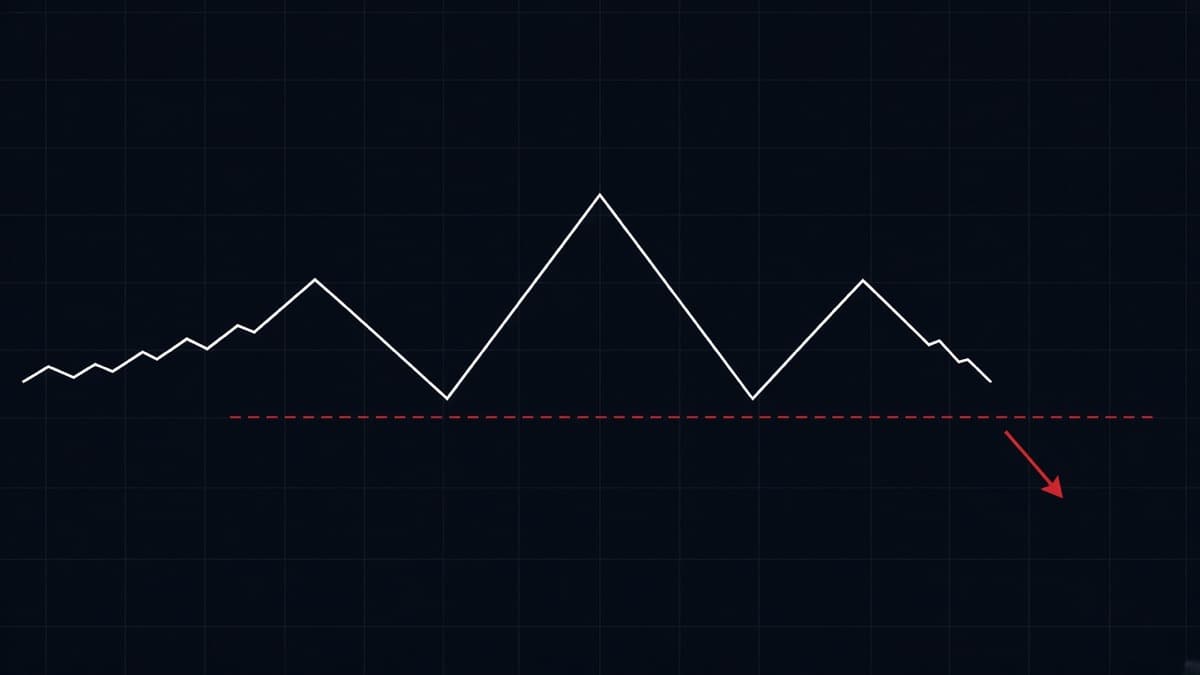
Three pushes where the middle one is the highest. Left shoulder, a pullback, a higher head, a pullback, then a right shoulder that stops near the left shoulder's height. The neckline runs under the two pullback lows.
The reason it works is plain enough. The market tried to make a new high, made one, then could not repeat it. The second pullback low is where the last group of buyers defended. When that breaks, there is nobody left underneath for a while.
The inverse version marks bottoms. A left shoulder low, a deeper head low, a right shoulder at roughly the left shoulder depth, a neckline across the two bounce highs.
The most common mistake is forcing the pattern onto any three-push shape. If the right shoulder trades above the head, there is no pattern, there is an uptrend. Drawing rules, the sloping neckline case, the measured target and clean invalidation are all in the head and shoulders guide.
Rounded base and cup with handle
Not every reversal is sharp. Sometimes price grinds lower, flattens out over many bars, and grinds back to the old high. There is no single low to point at, which is why this one gets ignored, and why the level that matters is the old high rather than anything inside the base.
The handle is the useful part for a trader. After price returns to the rim it usually pulls back a little, and that pullback is shallow: it should stay in the upper part of the cup. A deep handle that gives back most of the right side of the cup is telling you the buyers who carried price up are gone. On a 1h FX chart this whole structure can take a session or two to form. On 1m it can appear in twenty minutes and mean much less.
Continuation patterns: flags, pennants, triangles, rectangles
Flags
A flag is a sharp move, then a tight drift against it inside two roughly parallel lines. Bull flags drift slightly down. Bear flags drift slightly up. The sharp move is the pole and it carries the information: it tells you which side is in control.
The quality test for a flag is depth and time. A good flag gives back a small part of the pole and does it quickly. A flag that retraces most of the pole and takes as many bars as the pole took is not a pause, it is a fight, and the next move is genuinely unclear. Tight and quick beats deep and slow every time.
Pennants
The same idea with converging lines instead of parallel ones. Steep pole, then a handful of bars that pinch into a small cone, then continuation.
Pennants are small by definition. If your cone spans forty bars it is a symmetrical triangle, which is a different animal with a weaker directional bias. A pennant that stretches out in time loses the thing that made it useful: price has had time to think, and the pole's momentum has drained away.
Triangles
Three types, and the difference is which side is flat.
| Pattern | Highs | Lows | Usual break |
|---|---|---|---|
| Ascending triangle | flat | rising | up through the flat level |
| Descending triangle | falling | flat | down through the flat level |
| Symmetrical triangle | falling | rising | with the trend it sits in |
In an ascending triangle the flat highs are the level, and the rising lows tell you buyers are paying more each time. That combination is the reason the break tends to go up. Flip everything for a descending triangle: sellers accept less each time while the buyers keep defending one price.
Symmetrical triangles have no built-in bias. They tell you volatility is shrinking and something is about to change, nothing more. Use the trend around them for direction, and if you cannot identify one, skip it. Full detail on all three, plus wedges and pennants, is in triangles, flags and wedges.
Rectangles
Two flat levels, price rotating between them, no trend inside. Also called a range or a box. Rectangles after a strong leg are usually continuation. Rectangles after a long trend that has already lost momentum are often distribution.
The practical value of a rectangle is not the breakout, it is the two clean levels it hands you while it lasts. Fading the edges of a range works until the range ends, which is exactly the problem, so take the fade only while price is still respecting the boundary and stop when a close lands outside.
Where do wedges fit?
Wedges sit awkwardly between the two categories, which is why they confuse people. Both boundaries slope the same way and they converge.
A rising wedge has rising highs and rising lows, but the lows rise faster, so the range tightens as price climbs. That means each new high is a smaller achievement than the last. It usually breaks down, and it can appear at the end of a rally or inside a downtrend as a pullback.
A falling wedge has falling highs and falling lows, with the highs falling faster. Selling is getting weaker while price still technically declines. It usually breaks up.
The honest version of the wedge story: you are watching momentum drain out of a move while price continues in that direction. That is a warning, not a signal. The signal is the break of the line, same as everywhere else.
How do you measure a chart pattern target?
Every classic pattern has a measuring rule, and it is arithmetic rather than prediction. Take the height of the pattern and project it from the point where price left the pattern.
- Double top or bottom: distance from the highs to the neckline, projected from the neckline.
- Head and shoulders: distance from the head to the neckline, projected from the break point.
- Triangle or rectangle: the widest part of the shape, projected from the breakout level.
- Flag or pennant: the length of the pole, added to the breakout level.
Worked example. EUR/USD tops twice at 1.0920. The pullback low between the highs sits at 1.0880. The height is 40 pips. Price closes below 1.0880, so the measured target is 1.0840. That is the number, and here is what it is good for: deciding whether the trade has enough room to be worth taking, and where to consider taking profit if it runs.
What it is not good for is certainty. Price often stops a little short, because other traders are targeting the same round number. Sometimes it blows through and doubles the move. Sometimes the break fails and price never gets a third of the way there. Treat the measured move as a ruler, not a promise.
On binary options the measured move matters in a different way, because you are not taking profit at a price, you are choosing an expiry. If the target is 40 pips away and the pair has been covering 8 pips in a 1m candle during the London session, then a 1m expiry is not asking for the target, it is asking for the first push. Size the expiry to the leg you actually expect, which is the argument made in full in binary options expiry times explained.
Does volume confirm a chart pattern?
Where you have real volume, it helps. On FX spot and on binary platforms you often do not, so be careful about how much weight you put on it.
The classical reading: volume dries up while a continuation pattern forms, then expands on the breakout. In a head and shoulders the head often prints heavier volume than the right shoulder, which says the second attempt had less participation behind it. A breakout on volume that looks like any other bar is less convincing than one that clearly stands out.
The problem in retail FX is that the volume on your chart is tick volume from one feed, not exchange volume. It is a count of price updates, not of contracts. Tick volume still tells you something about activity, and it does move with session opens, but it is a weaker tool than volume on a futures or stock chart.
Practical substitute when volume is unreliable: use range and speed. A breakout bar that is visibly larger than the last twenty bars, and that closes near its extreme, is doing what a high-volume breakout does. A breakout bar the same size as the chop it came from is the one that gets retraced. Session timing works as a proxy too. A level breaking in the first hour of London has more behind it than the same level breaking during the quiet hours, which is covered in forex pairs and trading sessions.
Why do chart patterns fail?
They fail constantly, and learning what failure looks like is worth more than learning another five pattern names.
The most common failure is the fake break. Price closes just beyond the line, pulls in everyone who was waiting for confirmation, and then closes back inside the pattern within one or two bars. The traders who chased the break now have stops sitting just outside the pattern, and those stops become the fuel for the move in the other direction. This is why a failed pattern often produces a faster move than the pattern would have.
Reasons patterns fail, in rough order of how often you will meet them:
- The line was never valid. One touch, or a line drawn through bodies to make the shape look tidy.
- Wrong context. A reversal pattern taken against a strong trend that is still making higher highs and higher lows.
- Dead liquidity. A break at a time when nobody is trading the pair, so there is no follow-through to carry it.
- News. A scheduled release wipes out whatever structure was building, and the shape becomes irrelevant.
- The pattern was the bait. Everyone can see the same double top, the stops above it are obvious, and the level gets taken deliberately.
Two things save you money here. First, wait for the close, not the touch. Second, accept the invalidation when it arrives instead of adding to the position. A failed break is information: it tells you the other side had more size than you thought, and the highest-probability next move is often in the direction the break failed towards.
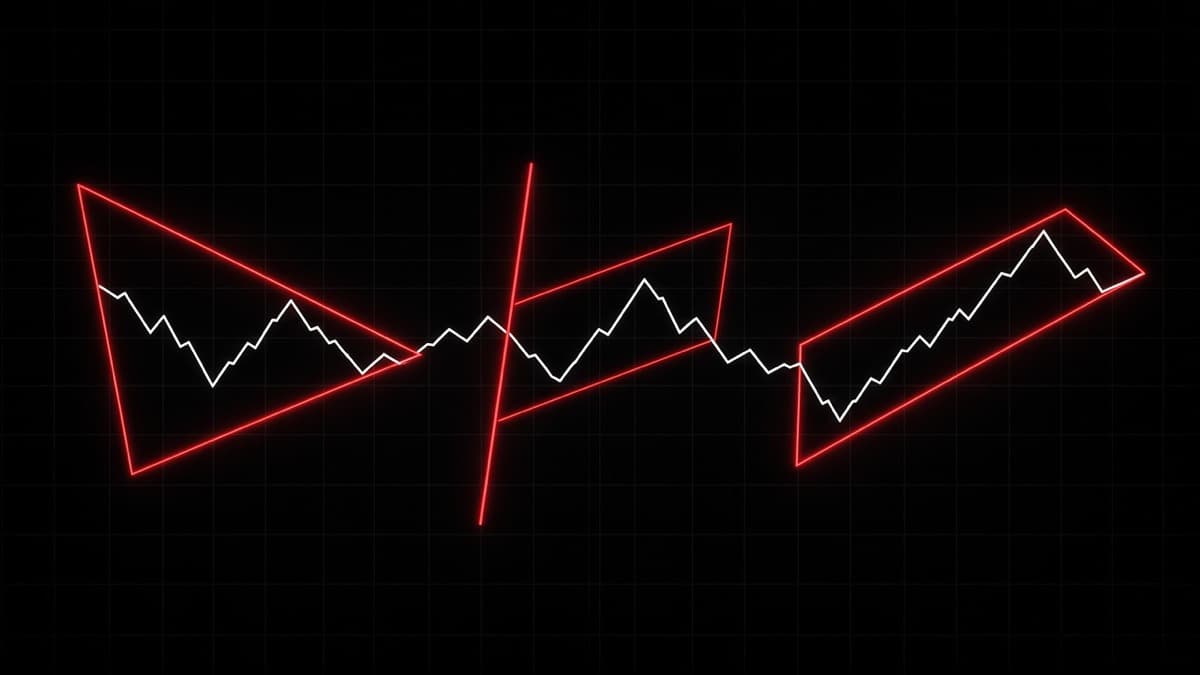
The chart above is the other failure mode, and it happens before the trade. If you widen your eyes enough you can draw a triangle on anything. The test is whether the range is genuinely getting smaller and whether each line has real touches. If not, close the drawing tool.
Are chart patterns still reliable when everyone can see them?
This is a fair question and the answer is not a simple yes.
The optimistic version of pattern trading assumes the shape has predictive power on its own. It does not. What it has is a crowd. A large number of traders draw the same neckline on EUR/USD, place stops in the same place and enter on the same close. That crowd is the mechanism. The pattern works when the crowd's orders push price, and it fails when someone larger uses those same orders as a place to get filled.
Both outcomes come from the pattern being visible, which is why the interesting question is not whether patterns work but who is on the other side of the obvious trade. A double top under a big round number, on a pair in a strong uptrend, with an obvious cluster of stops above it, is a level someone might well go and take. The same double top after a long distribution phase, where the trend has already flattened, has nobody underneath it defending.
So use the crowd rather than arguing with it. Take breaks where the pattern sits in the direction of the larger trend, because then the crowd and the trend agree. Be slow to take patterns that require the trend to end, unless you have structural evidence that it already has. And treat an obvious level in a quiet hour as a candidate for a sweep rather than a breakout.
Patterns being widely known does not spoil them, it just means you cannot trade them mechanically. The shape tells you where the crowd is. Your job is to decide whether that crowd is about to be proved right or used as liquidity.
What to do while the pattern is still forming
Most of a pattern's life is spent unfinished, and this is where traders lose money without needing a bad breakout.
While a double top is still forming, there is no trade. Two highs and a pullback is just a range with a story attached. While a flag is still drifting, there is no trade either, because the flag can widen into a reversal at any point. The correct action during the build phase is to prepare, which means drawing the line, writing down the invalidation price, and deciding the expiry you would use if the break came.
There are two things worth watching while you wait. First, where the pattern is failing to get to. A right shoulder that stops well short of the head's height is telling you sellers are getting there earlier each time. A flag that cannot lift back above the middle of its channel is telling you buyers have lost interest before the break has even happened. Second, the behaviour at the line itself. Small bodies with long wicks into the level suggest absorption. Full-bodied candles pressing into it suggest the level is about to go.
The discipline part is not entering early. Entering before the break is an attempt to get a better price in exchange for trading a pattern that does not exist yet. Sometimes it pays and that is what makes the habit stick. On binary, where you cannot cut a bad entry and the expiry is fixed the moment you commit, an early entry is simply a worse version of the same trade.
How do chart patterns look on 1 minute versus 1 hour?
The same, in outline, and very different in practice.
On a 1h chart a double top takes hours to build. The two highs are usually within a few pips of each other, the neckline is obvious, and the break is one clear candle. You get time to draw the line, check the context and decide. The cost is that there are far fewer patterns.
On a 1m chart the same pattern forms in twenty minutes. The highs sit inside a wider band relative to the moves involved, there is more chop between them, and the neckline gets clipped by wicks that mean nothing. You get many more setups and a much worse signal-to-noise ratio. Spreads and payout structure matter more too, because your target is smaller relative to the cost of trading.
| 1m | 1h | |
|---|---|---|
| Pattern forms in | minutes | hours |
| Highs and lows | inside a band | close to exact |
| Noise around the line | high | lower |
| Setups per session | many | few |
| Time to decide | seconds | minutes |
The approach that survives on fast charts is to read structure on a higher timeframe and execute on the lower one. Mark the 15m or 1h neckline, then drop to 1m and watch how price behaves at that price. You get the reliability of the higher-timeframe level with the precision of the lower-timeframe entry. What you must not do is draw a 1m pattern, ignore the 1h trend that is running straight through it, and then wonder why the break failed.
Chart patterns on OTC pairs
OTC pairs have their own order book and their own feed, so their charts are not a copy of the matching live pair. The patterns still appear, because the mechanics that create them are the same, but there are differences worth knowing.
OTC price action is often smoother between levels and quicker at them. Ranges can be tighter, and weekend OTC behaviour can feel different from weekday behaviour on the same symbol. Quotex shows OTC pairs as EUR/USD (OTC). The Quotex trading guide covers the lists.
Two adjustments for OTC:
- Draw your levels on the OTC chart itself. A neckline from the live EUR/USD chart does not transfer to the OTC symbol at the same price.
- Keep the pattern recent. OTC structure from several hours ago carries less weight than the last hour, so favour levels that price has tested in the current session.
Everything else holds. Continuation or reversal, one line, wait for the close, know the invalidation.
How REDBERRY reads structure
REDBERRY is a non-profit informational signal desk, not a broker, and it does not place trades for you. What it does is read the market and produce a direction call that you can compare with your own chart work.
On live pairs, REDBERRY uses the TradingView API for realtime price and chart structure, so the algorithm can see the same highs, lows and levels you are looking at. Inbuilt strategies then predict the next move on the pair you selected. Live covers 17 FX pairs and the generate time is always 1 minute.
On OTC, REDBERRY uses private Quotex API access for a live OTC price feed, with the same inbuilt strategies applied to the pair and timeframe you choose.
Signals are not 100% accurate, and nothing has a guaranteed read on the next candle. The way to use a desk signal with pattern trading is as agreement or disagreement, not as an instruction. If you have marked a neckline on GBP/USD, price has just closed through it, and the desk call points the same way, that is two independent reasons pointing in one direction. If the desk call points the other way, the sensible answer is usually to take neither trade and wait for the next setup. How the desk builds a call is in how REDBERRY generates live and OTC signals, and the seat and licence rules are in licence and seat rules.
Entry, stop and expiry: turning a pattern into a trade
A pattern is not a trade until you have decided three things: where you get in, what tells you that you are wrong, and how long you are giving it.
Entry. Two honest choices. Enter on the close beyond the line, which gets you in early with a higher failure rate. Or wait for the retest of the line from the other side, which gets you a better price and a tighter invalidation but sometimes leaves you behind, because not every break comes back. The retest entry suits patient traders and higher timeframes. The break entry suits fast charts where waiting means missing the whole move.
Invalidation. For a reversal, it is a close back inside the pattern. For a continuation pattern, it is a close through the far side of the flag or triangle. Put the number on your chart before you enter. If you trade spot, that is your stop. If you trade binary, you cannot place a stop, so the invalidation level becomes a mental rule: if price closes back inside before your expiry, treat the idea as dead and do not repeat it on the next candle out of frustration.
Size and expiry. Risk a fixed small percentage per idea, the same amount whether the pattern looks beautiful or ordinary. The REDBERRY desk rules ask for 1 to 2 percent per signal, and that number exists precisely because confidence is a bad guide to outcome. The full argument is in risk management for binary trading. For expiry, match the timeframe you drew the pattern on, and remember that a 1m expiry on a pattern measured over two hours is a bet on the first push rather than on the target.
A pre-trade checklist
Run this in under twenty seconds. If any answer is no, pass.
- Can I draw the line with at least two clean touches, and did I draw it before the break?
- Is the pattern pointing with the trend it sits in, or do I have a real reason for taking it against that trend?
- Did price close beyond the line, rather than just wick through it?
- Do I know the exact price that kills this idea?
- Is there room between the break and the measured target, relative to what the pair moves in the time I am giving it?
- Is the session liquid right now, and is there no scheduled release inside my expiry window?
- Is my size the same as it was on the last trade?
Keep this short. The point of a checklist is that you actually use it, and a fifteen-item list on a 1m chart just gets skipped.
Mistakes that cost the most
Naming before drawing. You spot a shape, you name it, and then you go looking for the line to support the name. Reverse it. Find the levels first, then see whether a pattern happens to exist around them.
Trading every break. Most of what looks like a pattern break is a poke through a level in a quiet market. Wait for closes, and be willing to sit out a session where nothing sets up cleanly.
Ignoring the trend. A double top inside a strong uptrend is much more likely to be a pause before another leg than a top. If the pair is making higher highs and higher lows on the timeframe above yours, be very slow to take reversal patterns against it.
Widening the pattern to stay in. Price invalidates your double top, so you redraw the neckline a little higher and tell yourself the pattern is still valid. This is the same error as moving a stop, and it is a discipline problem rather than a technical one. Trading psychology and discipline deals with it directly.
Revenge trading a failed break. The failed break hurts precisely because it looked clean. Taking it again immediately, bigger, is the most reliable way to turn one loss into five. That habit and its cousins are listed in common binary trading mistakes.
Confusing a pattern with a reason. The market does not owe you a move because your drawing was tidy. The pattern is a way of organising a guess about where orders sit. Keep the position small enough that being wrong is boring.
Where to go deeper
Three detail articles carry on from here, each covering the drawing rules, the retests, the measured targets and the failure cases in depth:
- Double top and double bottom for the two-touch reversals, including the sweep version and how they look on 1m against 1h.
- Head and shoulders pattern for the three-push reversal, neckline slope rules, the inverse version and clean invalidation.
- Triangles, flags and wedges for continuation patterns, plus how to tell a real squeeze from noise.
If you are new to the instrument rather than to the charts, start with what is binary trading and then come back to the patterns.
Questions people ask
What is the difference between a chart pattern and a candlestick pattern?
A candlestick pattern is one to three bars and tells you what happened inside a short window. A chart pattern is built from many bars and marks a level that a lot of orders sit on. They work together: the chart pattern gives you the line, the candles tell you how price behaved when it reached that line.
Which chart pattern is the most reliable?
There is no single answer, and anyone quoting an exact success rate is guessing. What changes the odds is the quality of the line, not the name of the shape. A neckline that has been touched three times, in a liquid session, with a clean close through it, is worth more than a textbook shape drawn on one touch in a dead hour.
How do you know a breakout is real and not a fakeout?
You never know before the fact, so judge the close and the behaviour after it. A real break closes beyond the line, holds when price comes back to retest, and makes progress away from the level. A fakeout pokes through, closes back inside the pattern within a bar or two, and takes out the traders who chased the wick.
Do chart patterns work on OTC pairs?
The shapes appear on OTC feeds because the same order flow logic drives them, but OTC pairs run their own book and can be smoother or faster than the matching live pair. Treat OTC levels as valid, keep the risk small, and do not assume a level that held on EUR/USD live will hold at the same price on the OTC version.
What timeframe is best for chart patterns?
Anything from 5m up gives you cleaner lines because the noise averages out. On 1m you still get real patterns, just with untidy edges and fewer bars to confirm a break. If you trade short binary expiries, read the pattern on the higher chart and time the entry on the lower one.
Can I use a measured move target as a profit target?
It is a drawing rule, not a forecast. Measuring the pattern height and projecting it from the break gives you a reference point that tells you whether the trade has room. Price often stops short, sometimes runs past it, and sometimes never leaves the pattern.
Nothing here is financial advice. Signals and setups can be wrong, so only risk money whose loss will not change your life.