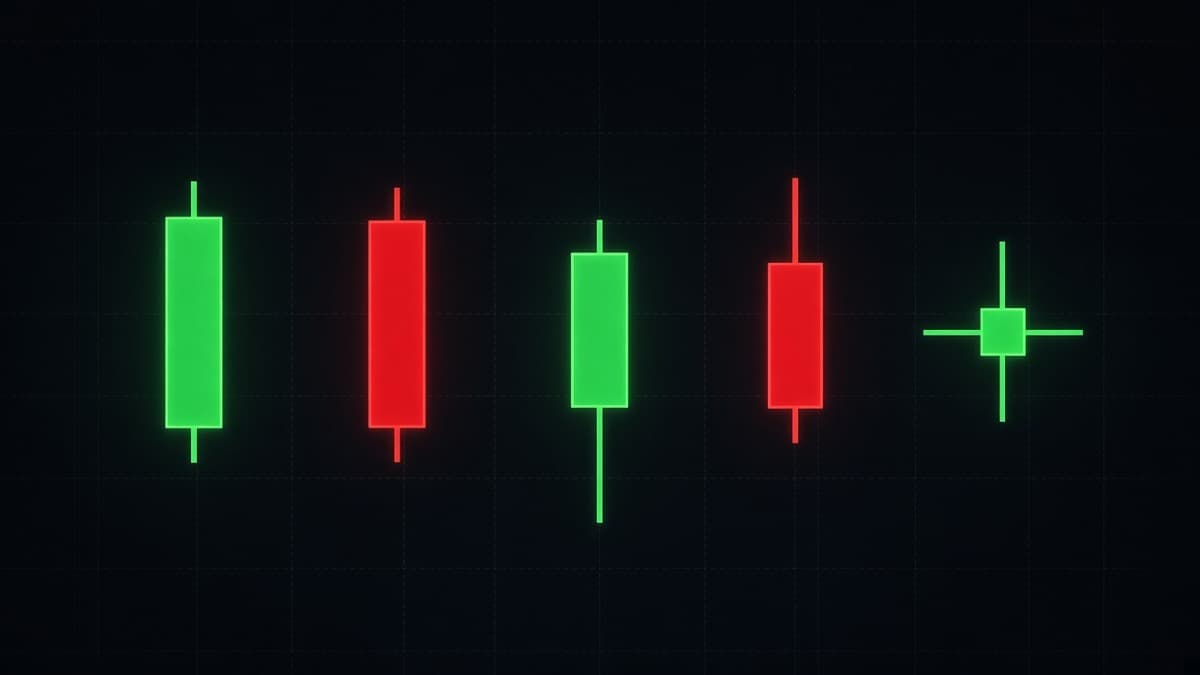
Doji Candlestick Patterns: What They Really Mean
Doji candlestick patterns explained: standard, long legged, dragonfly and gravestone, plus what indecision means inside a trend versus at a tested level.
A doji tells you one thing: the period closed where it opened. That is the entire message. It contains no direction, which is why trading a doji on its own is not possible in any sensible way, and why it is one of the most useful candles on the chart once you use it correctly.
Used correctly means as a filter. A doji says the side that was in control just failed to make progress. Whether that matters depends on where it printed. Inside a trending leg it is a rest. At a level price has already respected twice it is the sound of a move running out of road.
What counts as a doji
The open and close are the same price, or close enough that the body renders as a thin line.
There is no fixed pip threshold, and hunting for one is a waste of time. Judge the body against the recent candles on that pair and timeframe. A 2 pip body on GBP/JPY 1 hour is a doji. A 2 pip body on GBP/JPY 1 minute during London is an ordinary candle. Compare to the last ten or twenty bodies and the answer becomes obvious.
The body being zero is not the interesting part
The important information in a doji is in the wicks, not the missing body. A doji with tiny wicks means the period barely moved at all: a quiet, low participation candle with no story. A doji with long wicks on both sides means price travelled a wide range in both directions and still finished at the open, which is a very different event.
That distinction is what separates the four doji types, and it is the reason a "doji" on a cheat sheet is almost useless without knowing which one you are looking at.
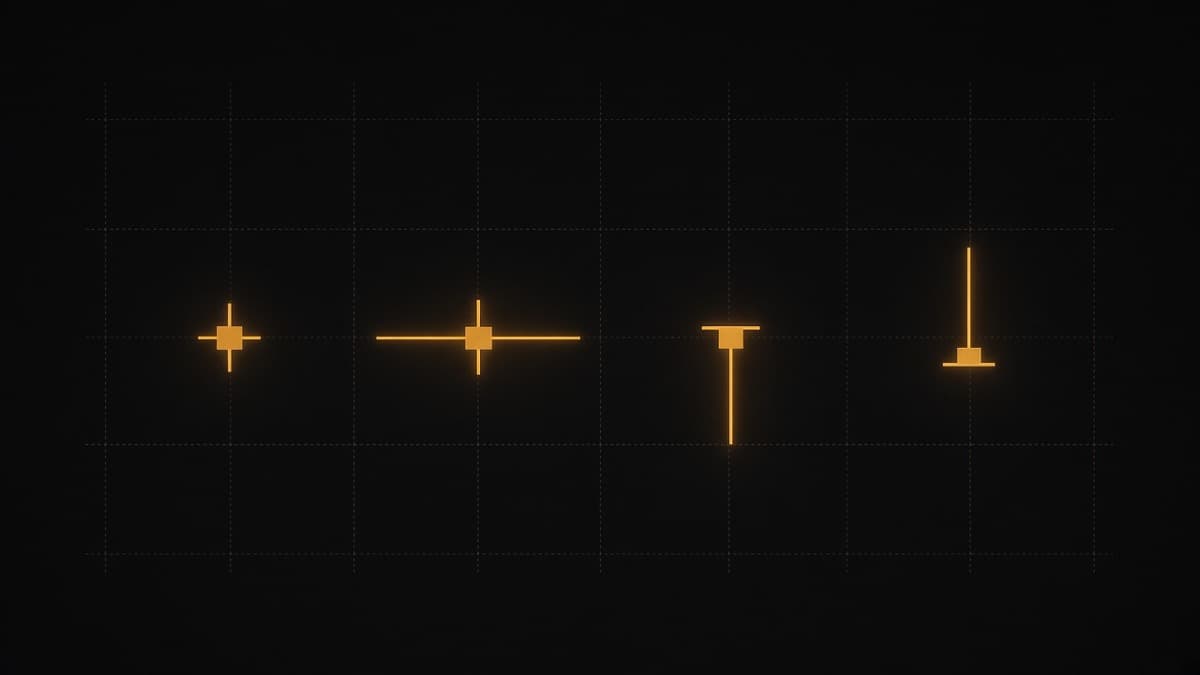
The four doji shapes
Standard doji
Small wicks either side, no body. The period opened, moved a little, and closed at the open.
Most standard dojis are noise. They appear constantly on lower timeframes and in quiet hours. The ones worth noticing are the ones that print at a level, or the ones that appear immediately after a large candle, because a big move followed by nothing is a change in behaviour.
There is an extreme version sometimes called a four price doji, where the open, high, low and close are all the same price and the candle renders as a single horizontal dash. That is not indecision, it is absence. It means almost nothing traded during the period. You see it on illiquid instruments and in the quietest hours, and the correct response is to widen the timeframe rather than to read it as a pattern.
Long legged doji
Long wicks on both sides, no body. This is the most informative doji, because something actually happened inside it.
Price ran up, got rejected, ran down, got rejected, and closed at the open. Both sides tried and both were pushed back. On a 15 minute candle that can mean a news release, a session handover, or a level being fought over from both directions.
What makes a long legged doji tradeable is the break of its range. The candle itself defines two prices worth watching: its high and its low. Whichever one gets taken with a real body close tends to be the direction the market resolves, because the argument inside the doji has been settled.
Dragonfly doji
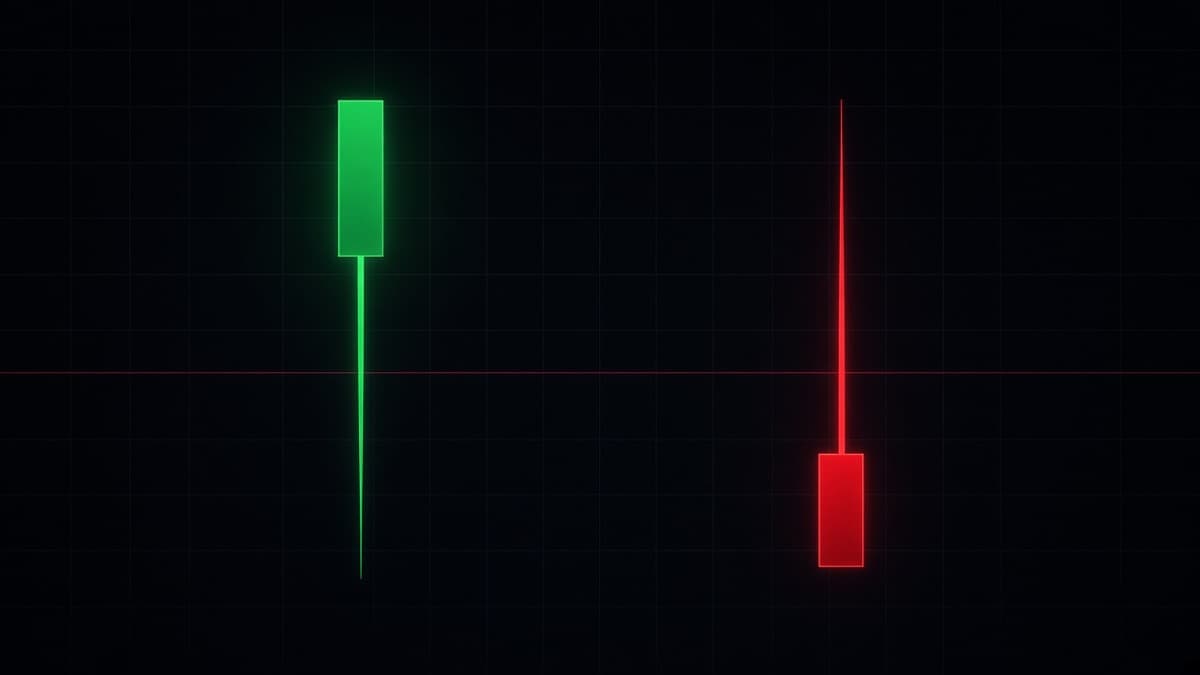
Open and close at the top of the range, long lower wick, almost no upper wick. It is a hammer with no body.
Read it like a hammer. Price was taken down, buyers absorbed it, and the candle finished back at its open. The difference from a hammer is subtle but real: because the close is exactly at the open rather than above it, there is no measure of buyers pushing past their starting point. The recovery was complete and stopped there.
The conditions are the same as for a hammer. It needs a decline in front of it, the wick needs to reach a price that already produced a reaction, and the next candle needs to hold above the doji low. Full treatment of the ratios and failure cases is in hammer and shooting star candles.
Gravestone doji
The mirror. Open and close at the bottom of the range, long upper wick, no lower wick. It is a shooting star with no body.
Price was pushed up during the period and gave all of it back. If that upper wick reached a resistance level, or ran just past an obvious prior high, the candle is showing an attempt to break out that was fully absorbed.
Same conditions in reverse: a rally in front of it, a level at the top of the wick, and a next candle that holds below the doji high.
Spinning top, the near doji
A spinning top has a small but visible body, usually a quarter of the range or less, with wicks on both sides. It is a doji with a slight lean.
In practice, treat it identically. The body is too small to argue for a direction, and the message is the same: the period produced no winner. The one advantage of a spinning top over a doji is that the body direction gives you a very weak tiebreaker if everything else is equal, and "very weak" is doing a lot of work in that sentence.
Comparing the four
| Type | Body | Wicks | Reads like |
|---|---|---|---|
| Standard doji | None | Small, both sides | A quiet period, usually noise |
| Long legged doji | None | Long, both sides | A fight with no winner |
| Dragonfly | None, at the high | Long below only | A hammer without a body |
| Gravestone | None, at the low | Long above only | A shooting star without a body |
| Spinning top | Small, under a quarter | Both sides | A doji with a slight lean |
What indecision means inside a trend
This is where most doji analysis goes wrong. A doji in a trend is not a reversal signal.
Trends do not move in a straight line. They advance, rest, and advance again. The rest periods produce small bodies and dojis, and that is completely normal behaviour rather than a warning.
Look at what surrounds the doji in that diagram. Higher highs and higher lows before it, no level above it, and a range that overlaps the previous candle instead of breaking away from it. Nothing was violated. One period did not make progress, and then the trend resumed.
The practical rule: inside a trend, a single doji is information about timing, not direction. It tells you the next candle is less predictable than the last one was. If you are taking short expiries on momentum, that is your cue to stop taking them for a few candles, not your cue to trade the other way.
What would change that reading is a cluster. Three small bodies in a row, with ranges that overlap each other, means the trend has stopped making progress and you are now in a range until something breaks.
What does a doji at support or resistance mean?
Same candle, completely different weight.
Price rallied into a price that has already stopped it before. The candle that printed at that price produced nothing. Buyers arrived at the level and could not close above it. That is a failure at exactly the point where a failure matters, and it is worth acting on.
What makes this version tradeable:
- The level was marked before the doji printed. If you drew the line after seeing the candle, you found the level to justify the candle, which is backwards.
- The doji is at the level, not near it. Its high should be touching or just past the line.
- The next candle picks the direction. A doji at resistance followed by a red body closing below the doji low is a setup. A doji at resistance followed by a green body closing above the level is a breakout, and you were on the wrong side of it.
The level quality matters more than the doji quality. A perfect doji at a random price is worth less than a scrappy small bodied candle at a price that has held three times. For how to identify the levels worth using, chart patterns explained covers the structures that produce them, and order blocks explained covers the zone version.
A worked example
EUR/USD on 1 hour. The pair has been grinding up through the European morning and reaches 1.0912, which is where a rally stalled twice the previous day. The line was on the chart before price got there.
The 1 hour candle that prints at the level opens at 1.0901, runs to 1.0915, drops to 1.0894, and closes at 1.0902. Body 1 pip, upper wick 13 pips, lower wick 7 pips. A long legged doji, and its high pushed 3 pips past the level before coming back.
Nothing to trade yet. What you have is two prices: 1.0915 and 1.0894. One of them is going to get taken with a real body, and that is the signal.
The next candle opens at 1.0902 and closes at 1.0889, below the doji low, with most of the range as body. That is the resolution. Sellers took the lower boundary of the argument, and the level held. Invalidation for a short from there is a close back above 1.0915, the doji high.
Now the version that goes the other way. If the next candle had closed at 1.0921, above both the doji high and the level, the same doji would have been the pause before a breakout. That is not a failed doji. It is a doji doing exactly what it always does, which is refuse to tell you the direction until the next candle arrives.
The habit to build from this: when a doji prints at a level, write down both boundary prices and wait. You are not predicting, you are waiting for the market to choose, and then taking the side it chose.
Dojis in a range: the no trade signal
Three dojis in a row inside a tight band is the market telling you there is nothing here.
This is worth saying plainly, because it is where a lot of accounts get slowly drained. Chop produces an endless stream of shapes that look like patterns. Every doji looks like it might be the reversal. Every small body looks like a pause before a break. In reality the range is the story, and the only trade in it is at the edges, if the edges are wide enough to be worth trading.
If your last three candles are dojis with overlapping ranges, close the chart for twenty minutes. That is a strategy, not an excuse. Trading psychology and discipline covers why the urge to trade chop is so strong.
When a doji does not reverse anything
That doji is technically perfect. Open and close at the same price, wicks both sides, printed after three candles of decline. Then price simply kept falling.
Nothing was wrong with the candle. The read was wrong, because there was no level under it and the downtrend was still intact. The doji marked one period where the selling paused, and pausing is not turning.
The lesson generalises to every indecision candle. A doji tells you the previous period produced no winner. It says nothing at all about who wins the next one. If you want a direction, you have to wait for a candle that gives you one, and that means a real body closing past something.
Which doji candles actually matter?
Most dojis on any chart are noise. These are the ones worth a second look, in rough order of usefulness.
A doji whose wick reached a marked level. The strongest version. Something was defended at a price you identified in advance.
A doji immediately after an unusually large candle. A wide body means one side pushed hard. A doji right after it means that push produced no follow-through at all. Whether the move continues or turns, the next few candles are less predictable than the last one.
A long legged doji with a range much wider than its neighbours. Price covered a lot of ground in both directions. Volatility arrived and went nowhere, which usually means a decision is close.
A doji at a session open or handover. London opening into a doji says the new participants arriving did not agree on a direction, which is genuinely unusual and worth noting. Session timings are in forex pairs and trading sessions.
And the ones to ignore.
Tiny dojis with tiny wicks. Nothing happened. The period was quiet.
Dojis in dead hours. Low participation produces small bodies by default.
Dojis in the middle of a range that has been chopping for an hour. Already covered above, and it bears repeating because this is the category that costs traders the most.
Dojis on very fast timeframes. On a 5 or 15 second chart, a body of zero requires almost nothing. Read structure where a candle means something.
Dojis inside bigger patterns
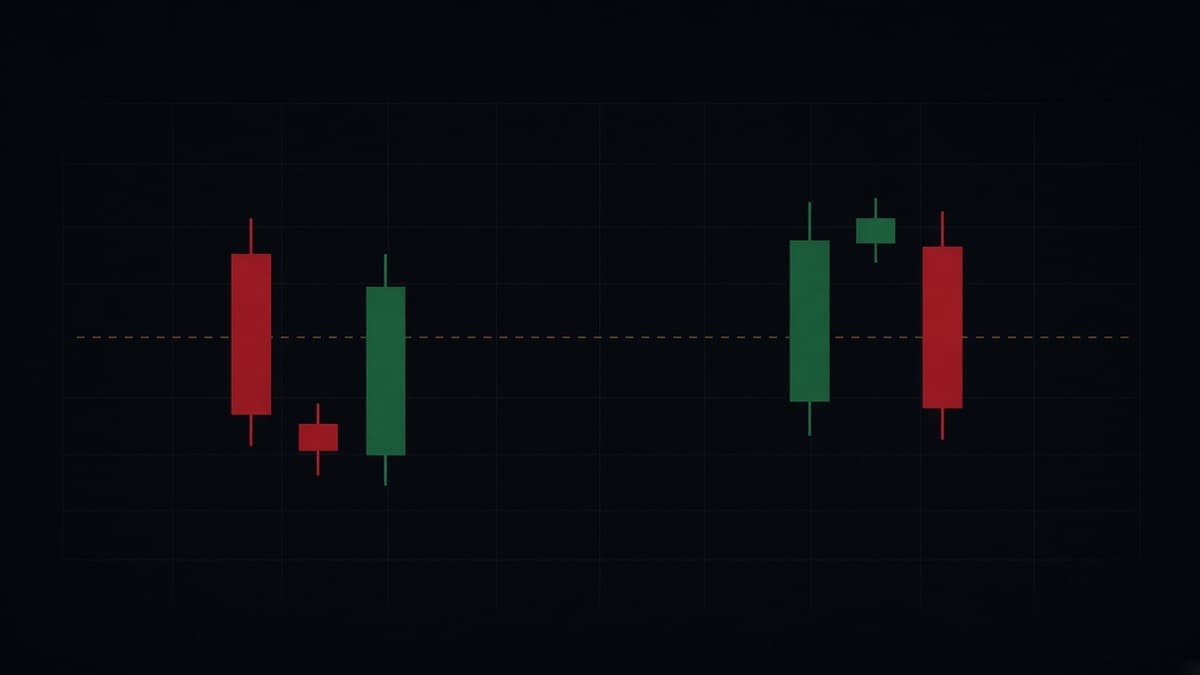
A doji becomes much more useful when it is the middle candle of a three candle sequence.
That is a morning doji star. Candle one: sellers in control. Candle two: a doji, so the selling produced nothing. Candle three: buyers take back more than half of the original move.
The doji in the middle is doing real work there. It is the evidence that the previous direction stopped before the reversal began, which is exactly what separates a three candle reversal from a single candle guess. The same structure at a top, with a doji above a long green candle, is an evening doji star. Both are covered with the midpoint rule and the gap question in morning star and evening star patterns.
A doji is also the second candle of many harami and tweezer formations, and the logic is always the same. On its own it is a stall. Attached to candles that give direction, it becomes the pause that makes the reversal readable.
The opposite extreme, for contrast
Putting a marubozu next to a doji is the fastest way to understand what body size measures.
A marubozu is all body and no wick: one side took the period and never gave anything back. A doji is all wick and no body: nobody took the period at all. Every candle on your chart sits somewhere between those two, and reading a chart is largely the act of noticing where on that scale each candle falls.
When you see a marubozu followed by a doji, you have just watched conviction turn into hesitation in two periods. That transition is often more useful than either candle alone.
Practical rules for trading dojis
- Never trade the doji itself. Trade the break of its range, or the candle after it, or nothing.
- Mark the doji high and low. Those two prices are the decision points. A body close beyond one of them is the signal.
- Require a level for reversal reads. Dragonfly at support, gravestone at resistance, standard doji at a range edge. Without a level, a doji is a timing note.
- Count them. One doji is a pause. Three in a row with overlapping ranges is a range, and ranges need a different plan.
- Check the hour. Dojis in dead hours are usually just low participation. The same shape at a session open means something else entirely.
- Match the timeframe to the decision. A doji on 1 hour is describing the next several hours. A doji on 15 seconds is describing almost nothing.
Dojis on short binary expiries
Short expiries and dojis are an awkward pair, because the doji is the one candle shape that explicitly refuses to give you a direction.
Two things help. First, use the doji as a stop signal rather than an entry signal. If you were taking momentum entries and a doji prints, sit out the next few candles. That decision alone removes a category of losing trades where you were right about the trend and wrong about the timing.
Second, when you do want to trade around a doji, trade the break. Mark the high and low, wait for a body to close beyond one of them, then take the direction with an expiry that matches the timeframe you read it on. Expiry matching is covered in binary options expiry times explained, and the position sizing side is in risk management for binary trading.
One note on OTC pairs. Very short OTC timeframes produce dojis constantly, because a period only needs a few ticks to close at its open. Those are not signals. Read structure on a timeframe where a candle represents a real amount of trading, then drop down for timing.
How REDBERRY treats indecision
REDBERRY is a non-profit informational signal desk for Quotex. It is not a broker, it does not hold funds, and it does not place trades.
Live pairs use the TradingView API for realtime price and chart structure, so the algorithm can read the market as it prints, then inbuilt strategies work out the next likely move. OTC pairs use private Quotex API access for a live OTC price feed, with the same inbuilt strategies. Body and wick relationships are part of what any price based method reads, and periods that close at their open are part of that record.
Signals are not 100% accurate. Nothing has a guaranteed read on the next candle. The reason to learn dojis by hand is not to argue with a signal, it is to recognise when the chart itself is undecided. A signal arriving during three overlapping doji candles and the same signal arriving as price rejects a marked level are different situations, and the difference belongs in your position size. How REDBERRY generates Live and OTC signals covers the mechanics.
For where dojis sit among the rest of the shapes, the complete guide to candlestick patterns puts single, two and three candle patterns side by side, and bullish and bearish engulfing candles covers the takeover patterns that often follow a doji at a level.
Questions people ask
What does a doji candle mean?
It means the period closed at, or almost at, its open price. Whatever happened inside the period, neither side finished ahead. That is a statement about one period only. Whether it matters depends entirely on where it printed: a doji in the middle of a trending leg is a pause, and a doji at a level price has already respected is a failure to make progress at the point where failure counts.
What is the difference between a doji and a spinning top?
Body size. A doji has essentially no body, so the open and close are the same price. A spinning top has a small but visible body, usually under a quarter of the total range, with wicks on both sides. They carry the same message with slightly different strength, and in practice most traders treat them the same way.
Is a dragonfly doji bullish?
It is bullish in the same conditional way a hammer is. The long lower wick with the open and close at the top of the range shows price was taken down and fully recovered inside one period. That becomes a usable read when it prints after a decline, into a level that has already produced a reaction, with the next candle holding above the doji low. Printed in the middle of a range it means very little.
How many pips of body can a doji have?
There is no fixed number, and looking for one is the wrong approach. Judge it relative to the recent candles on that pair and timeframe. If the body is a small fraction of the average body over the last ten or twenty candles, it reads as a doji. A two pip body is nothing on GBP/JPY 1 hour and is a normal candle on EUR/USD 1 minute.
Can you trade a doji on its own?
Not usefully. A doji has no direction in it, which means there is nothing to trade until the next candle picks a side. The practical way to use one is as a filter: it tells you the previous move has stopped making progress, so you either wait for a break of the doji range or stand aside.
Why do OTC charts show so many doji candles?
Short timeframes on any feed produce a lot of tiny bodies, because very little needs to happen for a period to close near its open. On a 5 or 15 second chart you should expect dojis constantly, and almost none of them carry information. Read the pattern on a timeframe where a candle represents a meaningful amount of trading, then use the short chart for timing only.
Nothing here is financial advice. Signals and setups can be wrong, so only risk money whose loss will not change your life.