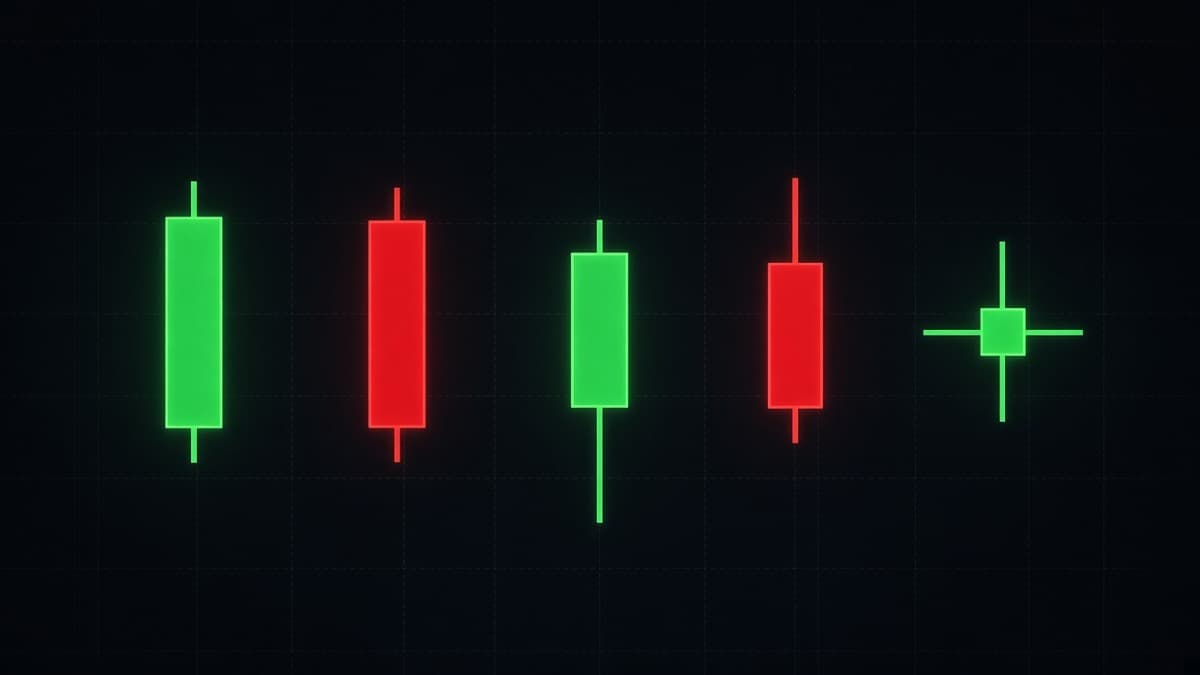
Candlestick Patterns: The Complete Guide for Traders
Candlestick patterns explained with diagrams: candle anatomy, single, two and three candle setups, where each one works, and why context beats the shape.
 Home
Candlestick patterns with the chart drawn next to the rule: what each shape means, where it works, and where it fails.
Candlestick patterns explained with diagrams: candle anatomy, single, two and three candle setups, where each one works, and why context beats the shape.
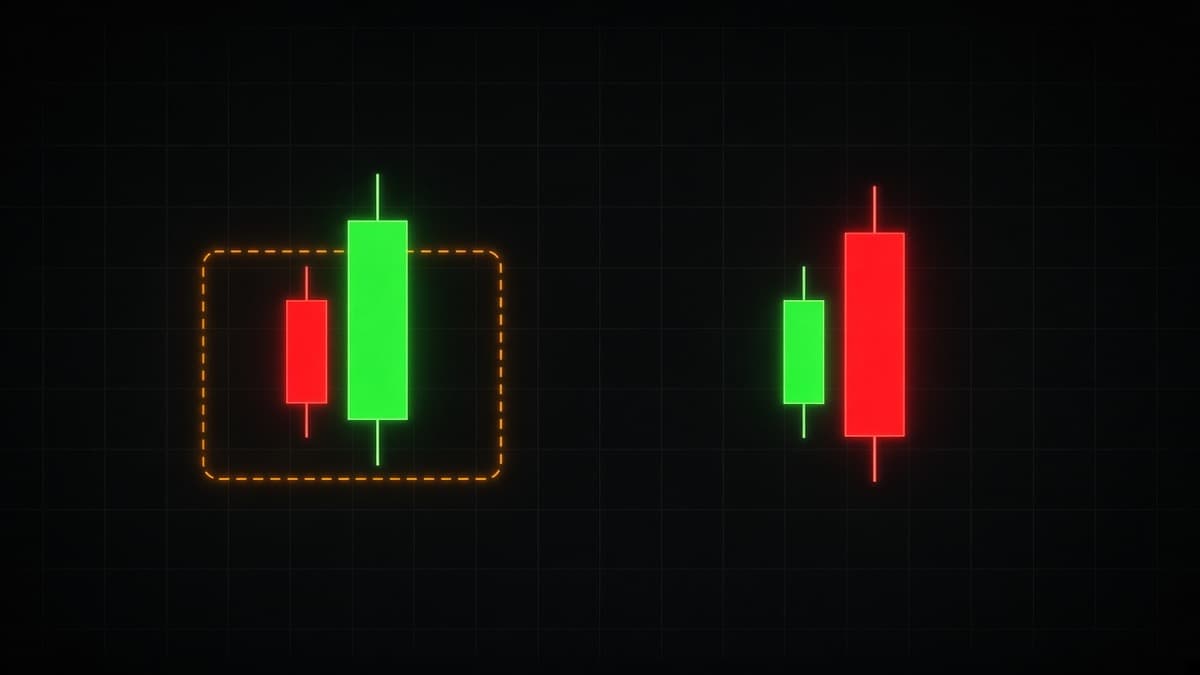
Bullish and bearish engulfing rules explained: body versus wick engulfing, what makes one valid, entry and invalidation levels, and the false signals to skip.
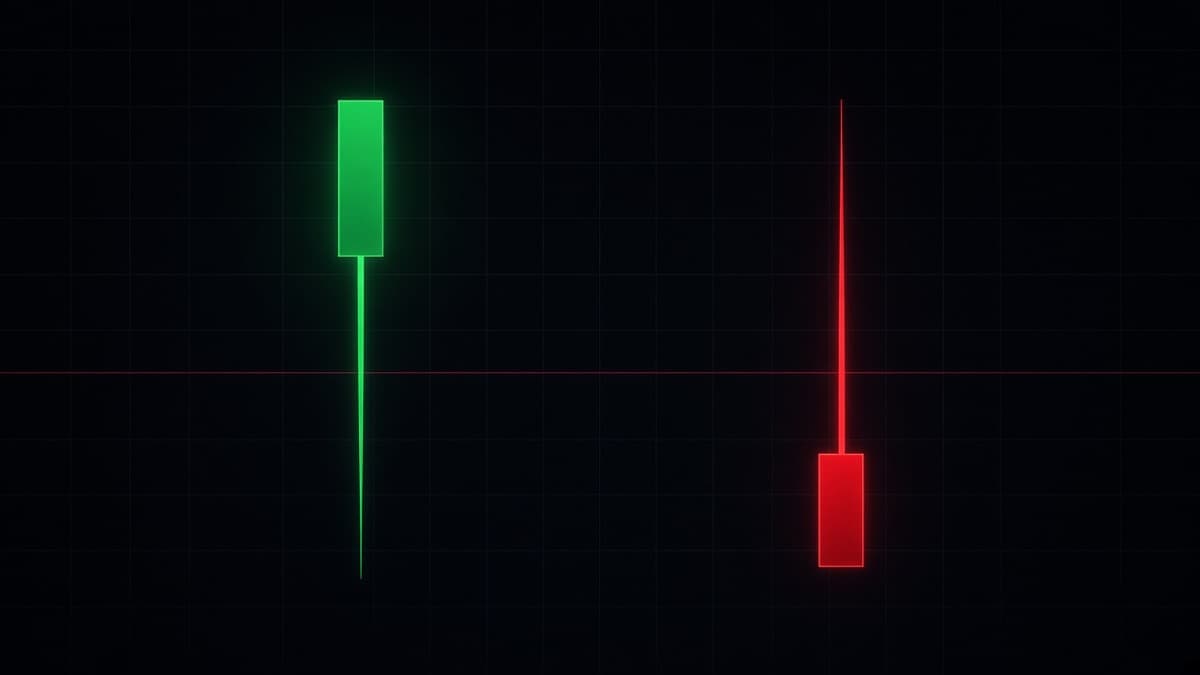
Hammer and shooting star candles explained: wick to body ratios, where each must appear, hanging man and inverted hammer, and why lone hammers fail.
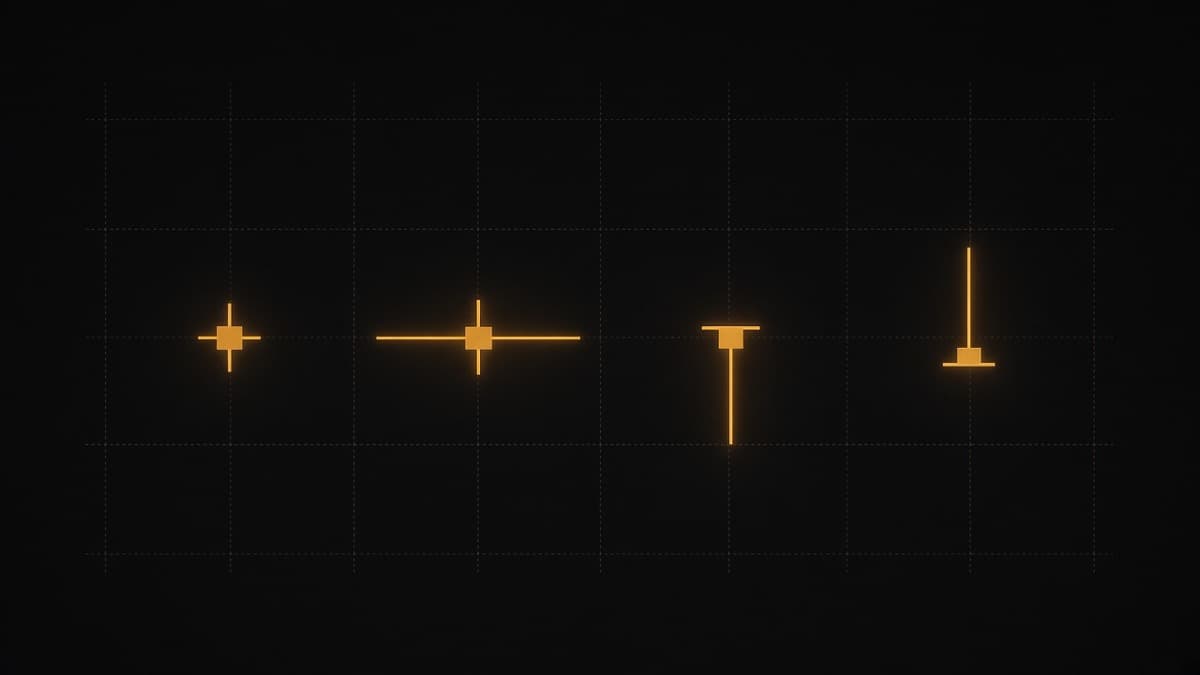
Doji candlestick patterns explained: standard, long legged, dragonfly and gravestone, plus what indecision means inside a trend versus at a tested level.
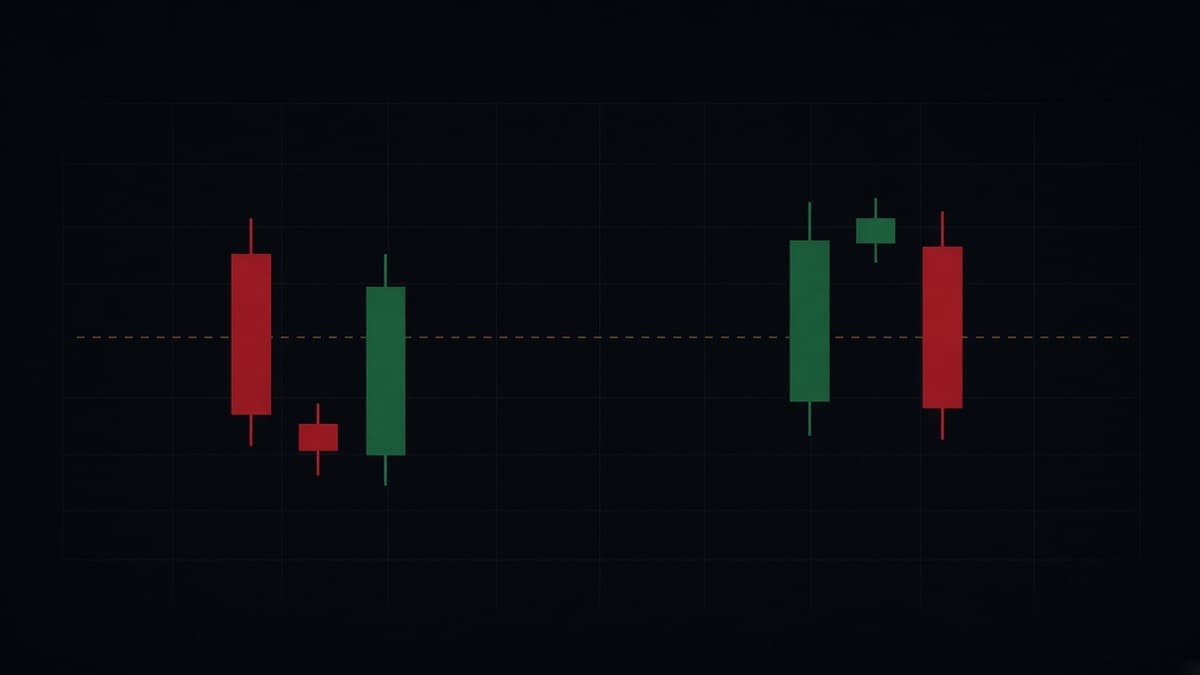
Morning star and evening star patterns explained: the three candle sequence, the midpoint rule, gaps on 24 hour markets, and behaviour on short expiries.
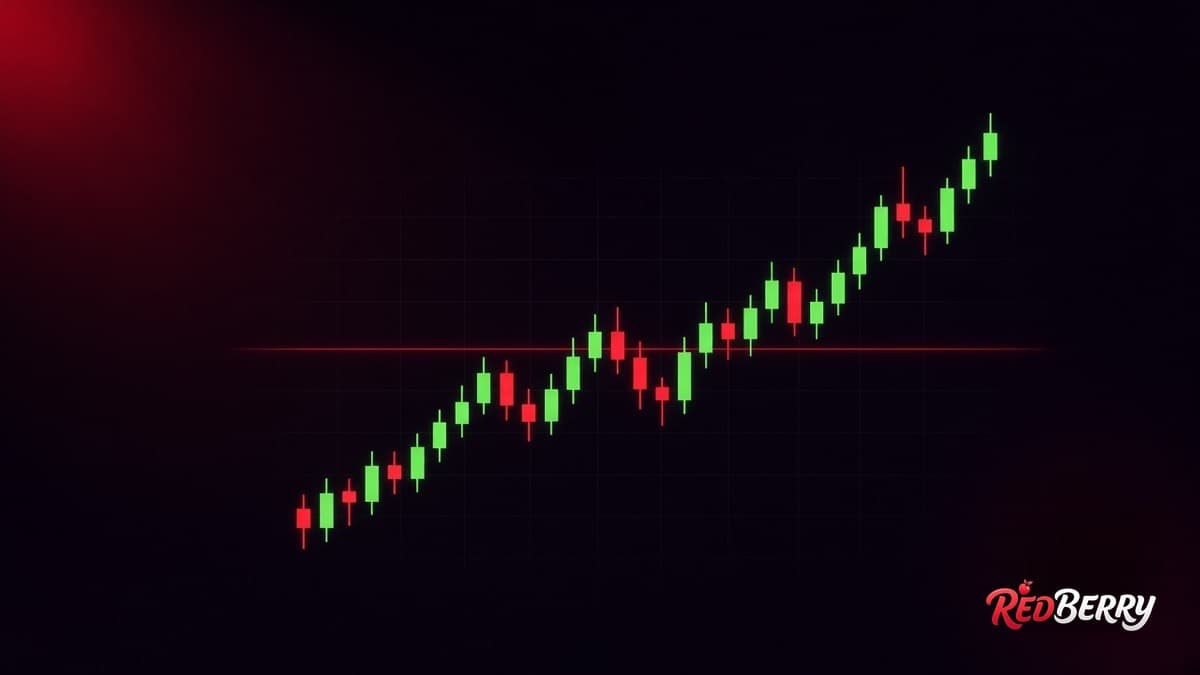
Japanese Bot borrows the prestige of candlestick charting. Here is how to test whether a signal tool reads candles at all, and what Redberry does instead.