Double Top and Double Bottom Patterns Explained
Double top and double bottom trading explained: where the neckline goes, why equal highs matter less than the break, retests, targets and the failed version.
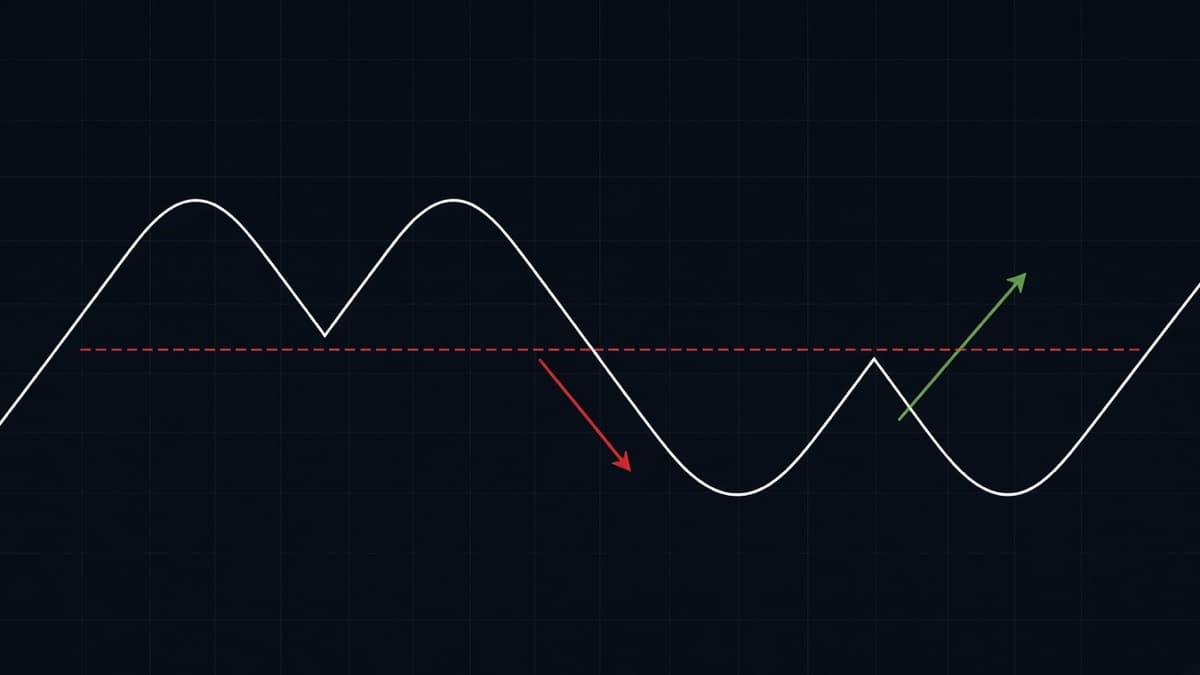
A double top is two attempts at the same price that both fail, and then a break of the low between them. That last part is the trade. Everything before it is preparation.
Most people get this backwards. They see the second high reject, call the top, and short into a market that has not broken anything yet. Price then pushes through both highs and the loss feels unfair. It was not unfair, it was early. The pattern is not a pattern until the neckline goes.
This article covers where to draw the neckline, how much the two highs really need to match, the sweep version that fools people, the retest entry, the measured target arithmetic, and what the failed version looks like. It is one of three detail pieces under the chart patterns complete guide.
What is a double top?
Price rallies, stalls at a level, pulls back, rallies again to roughly the same level, and fails a second time. That shape looks like the letter M. Then price breaks below the low of the pullback between the two highs and the pattern is complete.
Here is what is happening in orders. The first high is where sellers were sitting. Buyers who took that high got filled at the worst price of the move and are now underwater. Price pulls back, buyers who missed the first leg step in at the pullback low and push it back up. The second attempt runs into the same sellers, and this time the buyers who bought both highs have run out of reasons to hold.
The pullback low is where those buyers defended. When it breaks, their exits hit the market at the same time as new sellers coming in, and there is nothing underneath for a while. That is why the first leg after a neckline break is often the fastest part of the whole pattern.
What is a double bottom?
The same thing upside down. Price falls, bounces off a level, drops back to roughly the same level, holds, and then breaks above the high of the bounce between the two lows. The shape looks like a W.
The reading is the same in reverse. The first low is where buyers were sitting. Sellers who sold that low are now offside. The bounce high is where sellers defended, and when it breaks, their stops and fresh buying arrive together.
One practical difference. Bottoms on FX often take longer to form than tops on the same pair, because panic is faster than accumulation. A double bottom on USD/CAD 15m can spend a long time grinding between the two lows before anything happens. Do not force the break just because you are tired of watching it.
Where exactly is the neckline?
At the low of the pullback between the two highs, for a top. At the high of the bounce between the two lows, for a bottom. That is the whole rule, and getting it precise is most of the work.
Three details that decide whether your neckline is useful:
- Use the extreme, not a tidy average. If the pullback made two lows at 1.0884 and 1.0881, the neckline is at 1.0881. A break of 1.0883 is not a break.
- Draw it as a band, not a hairline. On 1m charts allow a pip or two either side, because the spread and the feed will produce wicks that cross a hairline level without meaning anything.
- Draw it before the second high completes. The neckline exists as soon as the pullback low is in place. If you only draw it after the break, you will always be reacting to something that already happened.
If the pullback between the two highs is very shallow, the pattern is weak. A double top where price barely dipped between the highs gives you a neckline right underneath the highs, which means a tiny pattern height and almost no room to the measured target. Bigger pullback, bigger pattern, more room.
Do the two highs need to be equal?
No, and this is where most confusion lives. The highs need to be in the same band, and the second one needs to fail to make real progress.
On 1h EUR/USD, two highs three pips apart is the same level. On GBP/JPY 1m, the band will be wider because the pair moves more per bar. Use the size of the recent candles as your guide: if the difference between the two highs is smaller than a typical candle's range on that chart, treat them as equal.
What matters more than the exact prices is how the second attempt behaved. Compare these two cases:
- The second push grinds up to the level over eight bars, prints a small body, and rolls over. That is a failure to make progress, and the pattern is valid.
- The second push rips through the level by twelve pips, holds there for six bars, and only then comes back. That is not a double top. That is a breakout that later failed, which is a different trade with a different invalidation.
Double top, or just the top of a range?
Both look the same at the moment the second high prints, and the difference decides how you trade it.
A double top needs a trend into the pattern. Price has to have come from somewhere lower, in a reasonably direct way, so that there are buyers holding positions who can be forced out. That is where the energy for the break comes from. If price has been rotating between the same two prices for two hours, the second touch of the high is not a reversal signal, it is the fourth or fifth rotation of a range.
Quick test. Look at the leg into the first high. If it is one impulsive move covering most of the recent range, you have a real double top candidate. If the approach to the first high was slow and overlapping, with several small pullbacks inside it, you are looking at range behaviour and the neckline is just the range low.
Why it matters: in a range, the high is a place to fade with a small target back towards the middle, and the break of the low is a lower quality signal because there was never a crowd trapped in the middle. In a double top after a trend, the break of the neckline has fuel behind it. Same drawing, different trade, different expiry.
When the second high sweeps the first
This is the version that fools careful traders. The second push goes slightly above the first high, takes the stops resting there, closes back below, and then breaks the neckline anyway.
If you invalidated the pattern the moment price ticked above the first high, you just got shaken out of a valid setup. If you decided the pattern was void only on a close above the highs that holds, you are still in the trade.
This is the same event described two ways. Classical pattern language calls it a false break of the high. Liquidity sweeps and stop hunts calls it running the stops above equal highs. Both descriptions point at the same order flow: the obvious cluster of stops above an obvious level is worth taking before the real move starts.
Practical handling: judge the highs on closes, and give the level a small tolerance based on the pair's normal candle size. If the poke closes back inside within a bar or two, the level held. If price closes above and stays there for several bars, the pattern is gone and you should stop watching it.
How to trade the break
Three moments, and you only need to pick one.
The break itself. Enter when a candle closes below the neckline. Earliest entry, most failures. On fast charts this is often the only option, because the retest may never come.
The retest. Wait for price to come back up into the neckline from below and fail there.
The retest gives you a better price and a tighter invalidation, because you now know exactly where the idea dies: a close back above the neckline. The cost is that plenty of breaks run away without ever coming back. If you only trade retests you will miss the fastest patterns and catch the cleanest ones.
The second leg. Some traders skip the neckline entirely and wait for the first lower high after the break, treating the pattern as a trend change rather than a breakout event. That is slower and it filters out most fakeouts.
Whichever you pick, write the invalidation price down before you enter. For a double top it is the close back above the neckline if you took the retest, or a close back above the highs if you took the break. A candle-level confirmation at the neckline helps here: a bearish engulfing candle into the line on the retest is a much better trigger than a small doji that could go either way.
The measured move target
Take the distance from the highs to the neckline and project it below the neckline from the break.
Worked example on EUR/USD 15m. Two highs at 1.0920. Pullback low at 1.0880. Height is 40 pips. Price closes below 1.0880, so the measured target is 1.0840.
What that number is for: deciding whether the trade is worth taking at all. If the target is 40 pips away and the pair has been covering 4 pips per 15m candle, a full run to target is several candles of work. If you are trading a 1m binary expiry on that break, you are not trading the target, you are trading the first push. Match the expiry to the leg you actually expect, which is the whole argument in binary options expiry times explained.
What the number is not: a promise. Price frequently stops short, especially just before a round number where other traders are already taking profit. It sometimes doubles the projection when the break catches a session open. Use it as a ruler.
Does volume help confirm the pattern?
Where you have real volume, the classic reading is that the second high prints less volume than the first. Fewer participants pushed price to the same place, which is the definition of a weaker attempt. A neckline break on clearly heavier volume than the bars around it is more convincing than one that looks like the rest of the chart.
The problem in retail FX and on binary platforms is that the volume on your chart is usually tick volume from one feed. It counts price updates, not contracts. It still moves with session activity, so it is not useless, but it is not the same tool as volume on an exchange-traded instrument, and it should never be the deciding vote.
A more reliable substitute is range and speed. Compare the breakout candle to the last twenty candles. If it is visibly bigger and closes near its low, it is doing what a high-volume break does. If it is the same size as the chop it came out of, expect a retest at best and a failure at worst. Session timing is the other proxy: a neckline breaking in the first hour of London has more behind it than the same level breaking in the quiet hours before Tokyo.
The version that fails
Failure is not rare. Plan for it.
The sequence above is the expensive one. The neckline breaks, sellers pile in on confirmation, and then price closes straight back inside the pattern. Those sellers now have stops above the highs, and when price gets there, their exits push it further. A failed double top often produces a faster rally than a successful one would have produced a decline, because everyone positioned for the break has to get out at once.
Why they fail, in rough order of frequency:
- The trend was still intact. A double top in the middle of a strong uptrend with higher highs and higher lows on the timeframe above is usually a pause, not a top.
- Dead liquidity. The break happened in a quiet hour with nothing behind it.
- The neckline was drawn loosely. A break of a hairline level that was never really the pullback extreme.
- News inside the window. Structure stops mattering when a scheduled release hits.
The useful response is to treat the failure as information rather than an insult. If a double top fails and price reclaims both highs, the path of least resistance is up, and the trade you should be looking for next is a long on a pullback, not a second short.
Triple tops and triple bottoms
Add a third touch and you have a triple top. The logic does not change, the level just has more evidence behind it.
With three touches there is one neckline, drawn under the lowest of the pullback lows, and there are more trapped traders above it. That usually means a cleaner break. It also means a fatter cluster of stops above the highs, so the sweep version is more likely too.
Do not go hunting for a fourth or fifth touch. Past three, what you have is a rectangle range, and the right way to trade it is as a range: fade the edges while they hold, and take the break when a close lands outside. Triangles, flags and wedges covers the range and squeeze cases.
How it looks on 1m versus 1h
The mechanics are identical. The experience is not.
On 1h, a double top on GBP/USD takes most of a session to build. The two highs come within a few pips of each other, the pullback low is obvious, and one candle closing below it is a clear event. You have twenty minutes to think while the candle forms.
On 1m the same structure takes half an hour. The highs sit in a band rather than at one price, there are several small swings inside the pattern that look like necklines but are not, and a single wick can cross your level without meaning anything. You get many more setups and a much higher share of them fail.
| 1m | 1h | |
|---|---|---|
| Time to form | 20 to 40 minutes | one session or more |
| Highs | inside a band | within a few pips |
| False breaks | frequent | fewer |
| Neckline candidates | several | usually one |
| Decision time | seconds | minutes |
The fix is to read structure one or two timeframes up and execute down. Mark the neckline on 15m, then watch 1m to see how price behaves when it reaches that price. You get a level that many traders can see and an entry you can time. Drawing a 1m double top while the 1h chart is in a clean uptrend is how most of these trades go wrong.
Double tops on OTC pairs
OTC symbols run their own book and their own feed, so the chart is not a mirror of the live pair. The patterns still form because the same order flow logic applies, but the prices are the platform's own.
Two rules. Draw the neckline on the OTC chart you are trading, never copied from the live EUR/USD chart. And prefer recent structure, because an OTC level from several hours ago has less weight than one that price tested in the last half hour. Quotex writes OTC pairs as EUR/USD (OTC). Platform mechanics are in the Quotex trading guide.
Using a desk signal alongside the pattern
REDBERRY is a non-profit informational signal desk, not a broker. It does not place your trades and it does not manage money.
On live pairs it uses the TradingView API for realtime price and chart structure, then inbuilt strategies predict the next move. Live covers 17 FX pairs and the generate time is always 1 minute. On OTC it uses private Quotex API access for a live OTC price feed, with the same inbuilt strategies applied to the pair and timeframe you pick.
Signals are not 100% accurate, so use a desk call as a second opinion on a pattern you have already marked. If you have a neckline on AUD/USD, price has just closed through it, and the desk call agrees, you have two independent reads pointing the same way. If they disagree, the cheapest decision is usually to skip the trade. How the call is built is in how REDBERRY generates live and OTC signals.
Grading the setup: A, B and skip
Not every valid double top deserves the same treatment. Rank them and you stop taking the worst ones.
An A setup has a clear trend into the first high, a deep enough pullback to give the pattern real height, two highs that fail in the same band with the second one visibly weaker, a neckline with a single obvious extreme, and a break that closes through during an active session.
A B setup is missing one of those. The pullback is a bit shallow, or the break happens in a slower hour, or the trend into the pattern was only moderate. These are tradeable at normal size, but expect a higher share of retests and failures, and do not chase if you miss the first entry.
A skip has two or more problems: a shallow pattern in a strong opposite trend, a neckline you had to guess at, a break that only wicked through, or a scheduled release landing inside your expiry. There is no shortage of double tops. Passing on the weak ones costs nothing and protects the average.
One last filter that catches a lot of bad trades: if you cannot explain in one sentence which group of traders is trapped and where their exits are, you have a shape, not a setup.
Checklist before you take the break
- Is the pullback low, or the bounce high, clearly identified, and did I draw it before the break?
- Are the two highs or lows inside a band that is reasonable for this pair and timeframe?
- Did price close beyond the neckline, rather than wick through it?
- Is the trend on the timeframe above me neutral or already turning, rather than running hard the other way?
- Is the pattern height big enough to justify the expiry or stop I am about to use?
- Do I know the exact price that kills the idea?
- Is my size the same as the last trade, at 1 to 2 percent as the desk rules ask, per risk management for binary trading?
Mistakes that cost the most
Shorting the second high. The second rejection feels like the signal. It is not. Half the time price grinds sideways and then makes a new high.
Redrawing the neckline. Price breaks your level by a pip, closes back inside, and you move the line down so the pattern still looks valid. This is a discipline problem dressed up as analysis.
Counting wicks as touches. On 1m every level gets touched a dozen times. Count reactions, not pixels.
Ignoring pattern height. A double top with a 6 pip gap between the highs and the neckline has almost nowhere to go after costs. Skip small patterns.
Doubling after the failure. A failed double top means you were wrong about who was in control. Taking it again, bigger, on the next candle is the fastest way to turn one loss into a bad session. Compare the three-push version in head and shoulders before you decide the top is still in.
Questions people ask
Do the two highs in a double top have to be exactly equal?
No. They need to sit inside the same small band. On a 1h EUR/USD chart that band might be 3 to 5 pips wide. On 1m it will be relatively wider. What matters is that the second attempt made no real progress past the first, not that the two prices match to the decimal.
Where do you put the neckline on a double top?
At the low of the pullback between the two highs. If that pullback has more than one low, use the lowest one, because that is the price where the last group of buyers defended. Draw it before the second high finishes and extend it to the right.
Is a double top confirmed by the second high or by the neckline break?
By the neckline break, and specifically by a close beyond it. Until then you have a range with two touches at the top. Many double tops never complete, price simply pushes through the highs and carries on.
What is the target of a double top?
Measure from the highs down to the neckline, then project that same distance below the neckline from the break. It is a drawing rule that tells you whether the trade has room, not a forecast. Price often stalls short of it and sometimes runs well past it.
What invalidates a double top?
A close back above the two highs after the break, or price never breaking the neckline and instead closing above the highs from inside the pattern. Once that happens the trapped sellers become the fuel for a rally, which is why failed tops often move fast.
Can you trade double tops on OTC pairs?
Yes, but draw the levels on the OTC chart itself rather than copying them from the live pair. OTC symbols run their own feed, so the same pattern can sit at a different price and can be tighter or faster than the live version.
Nothing here is financial advice. Signals and setups can be wrong, so only risk money whose loss will not change your life.