Bullish and Bearish Engulfing Candles: Exact Rules
Bullish and bearish engulfing rules explained: body versus wick engulfing, what makes one valid, entry and invalidation levels, and the false signals to skip.
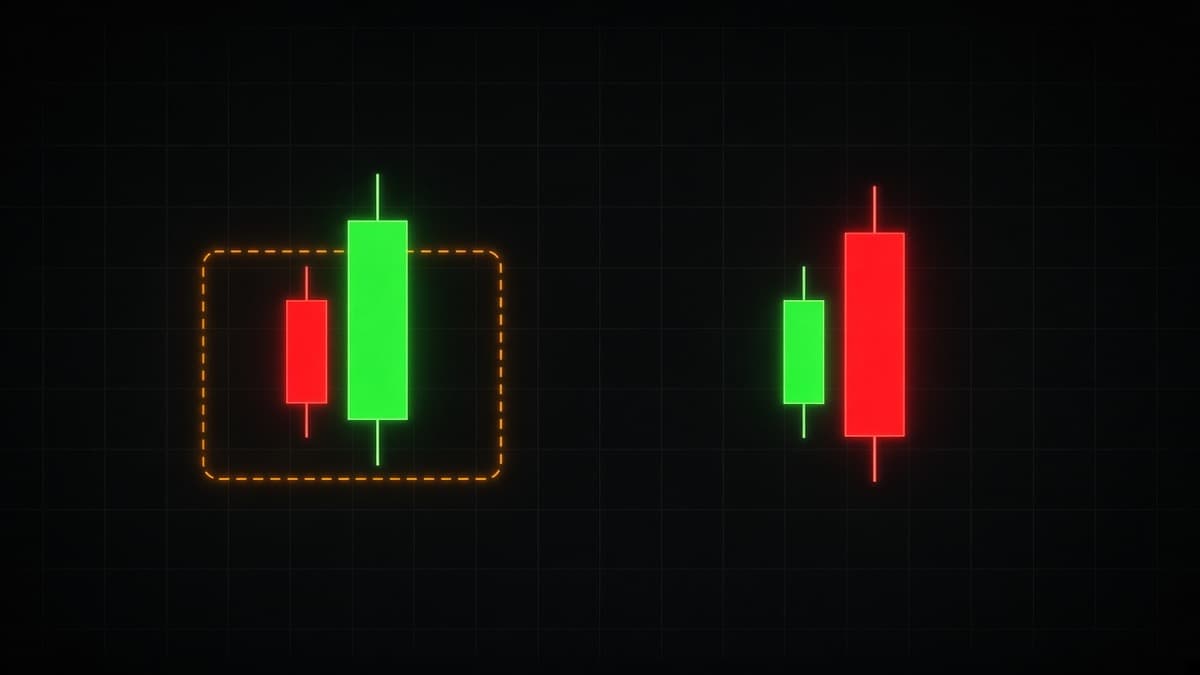
A bullish engulfing candle has one rule that people get wrong: the engulf is measured on the bodies, not on the wicks. Open at or below the previous close, close above the previous open. That is the pattern. A candle with a huge range and a small body is not engulfing anything, no matter how much of the previous candle its wicks cover.
Get that one distinction right and you will already filter out a large share of the engulfing signals that fail. The rest of this article is the exact rules for both directions, how to grade a valid setup against a worthless one, where entry and invalidation sit, and the false signals that repeat.
What makes a candle engulfing
An engulfing candle reverses the previous period outright. Whatever the last candle achieved, this one undid it and then closed past the start of it.
That is why the pattern carries more weight than a single candle shape like a hammer. There is a fixed reference point, which means there is a rule you can check rather than a proportion you have to judge by eye. Either the close cleared the previous open or it did not.
Bullish engulfing: the exact rules
- The previous candle closed red.
- The current candle opens at or below the previous close.
- The current candle closes above the previous open.
- The current candle closes green, obviously, since it closed above an open that was above its own open.
Wicks are not part of the rule. If the green candle's low is above the red candle's low, the pattern still stands.
On EUR/USD 15 minutes that looks like this. The red candle opens at 1.0862 and closes at 1.0849. The next candle opens at 1.0848 and closes at 1.0867. The second body runs from 1.0848 to 1.0867, which covers 1.0849 to 1.0862 completely. That is a bullish engulfing candle.
Bearish engulfing: the exact rules
- The previous candle closed green.
- The current candle opens at or above the previous close.
- The current candle closes below the previous open.
Same structure, opposite direction. One practical note on 24 hour markets. Forex and OTC pairs usually open each candle at, or within a tick of, the previous close, so condition 2 is satisfied almost automatically. The condition that does the work is condition 3. Focus your attention there.
What is actually happening inside the candle
It helps to stop thinking about the shape and think about the sequence of prices that produced it.
Take the bullish case on a 15 minute candle. The period opens at the low end of the previous candle's range, which means sellers were still in control at the start. For the next few minutes price probably drifts or dips. Then something changes. Buyers arrive with enough size to absorb the offers, price climbs back through the previous candle's body, and it keeps climbing until it closes above the price where the previous period began.
Everyone who sold during that previous candle is now underwater. Every stop sitting above the previous open has been reached. That is why the close matters so much: it is the price at which the previous period's participants collectively went from right to wrong.
Now take the version where the body does not reach the previous open. The same absorption happened, but it ran out early. Some sellers are underwater, most are not, and the period ends with the argument unresolved. The candle looks similar on a small screen. The consequence is completely different.
This is also why an engulfing candle formed on almost no trading tells you very little. The mechanism described above requires participants. If there were barely any, the candle is a shape produced by a thin book rather than a takeover.
Body engulfing versus wick engulfing
This is the distinction that separates traders who read candles from traders who pattern match.
Look at the left pair in that diagram. The second candle has an enormous range. Its wicks swallow the previous candle from both sides. But its body opens at 54 and closes at 56, while the previous body ran from 58 down to 54.6. The body did not reach the previous open. What that candle actually shows is a period where price fell hard, recovered hard, and finished in the middle. That is indecision with a wide range, not a takeover.
Now look at the right pair. The body opens at 47.8 and closes at 53.4, past the previous open at 51.4. Smaller range, more information. The close is the evidence, and the close went past a price that mattered.
When you see a candle with a very long wick and a small body, you are looking at a rejection pattern rather than a takeover pattern. That is not a bad thing, it is a different thing, and the rules for it are in hammer and shooting star candles.
What makes one engulfing candle valid and another worthless
The shape is binary. Either it engulfs or it does not. The quality is not binary at all, and five things decide it.
1. The level it prints at
This does most of the work.
A bullish engulfing candle at a price where buyers have already defended twice is a different event from the same candle 30 pips above that price. In the first case, the candle is evidence about a specific level that already has orders sitting at it. In the second case, the candle is a candle.
Levels worth marking: prior swing highs and lows, the edge of a range that has held more than once, a level that flipped from resistance to support, and the origin of the last impulse move. That last one is the zone idea covered in order blocks explained.
If you cannot point at the level, skip the setup. Not reduce size, skip it.
2. Where the close lands inside its own range
A bullish engulfing candle that closes in the top fifth of its own range is telling you buyers held the gain into the close. One that closes in the middle of its range is telling you sellers were already pushing back before the period ended.
Both technically satisfy the engulfing rule. Only one of them is a clean read.
3. The size of the body it engulfed
Engulfing a wide red body means a real amount of selling got reversed. Engulfing a tiny red body, or a doji, means almost nothing got reversed, and the pattern is mostly a technicality.
This is the version that fills up screeners. A scanner searching for engulfing candles will return dozens of cases where a large candle swallowed a one pip body. Nothing happened in those.
4. The trend it sits in
A bullish engulfing candle at a pullback low inside a 1 hour uptrend is a continuation entry. The same candle inside a 1 hour downtrend is a counter-trend trade.
Counter-trend engulfing candles can work, especially after a sweep of an obvious low, but they need more evidence and they deserve smaller size. If price has been making lower highs and lower lows all session, one green candle does not change the structure.
5. Whether liquidity was taken first
The strongest engulfing candles often come immediately after a wick has run through an obvious high or low.
The sequence matters. Price pushes through the level, the stops sitting past it get triggered, and that flow provides the volume needed to fill size on the other side. Then the candle closes back inside, and the next one engulfs. Traders watching the level alone saw a break. Traders watching the close saw a failed break. The mechanics are worked through in liquidity sweeps and stop hunts.
Entry and invalidation
Knowing where the idea dies is more important than knowing where to enter.
The three entry choices
At the close of the engulfing candle. Best price, no confirmation. You are trusting the pattern. On short binary expiries this is often the only practical option, because waiting for the next candle can mean the move is over before you are in.
On a break above the engulfing candle high. Confirmation that follow-through exists, at a worse price. This filters out patterns that stall immediately, which is a real category. The cost is that on fast reversals the break happens far above the close.
On a pullback into the engulfing candle body. Often the best risk to reward, because the invalidation is close. The problem is that strong reversals do not pull back, so this entry misses the cleanest moves.
There is no correct answer. Pick one, use it consistently, and record what happens. Mixing entry styles trade by trade makes your own results impossible to read.
Where the idea dies
For a bullish engulfing candle: the low of the engulfing candle. If price closes below it, buyers who took control during that period have lost it again, and the reason you took the trade is gone.
For a bearish engulfing candle: the high of the engulfing candle.
Two practical notes on that. First, use the candle low, not one pip under it. That price is where everyone else puts their stop, which makes it a magnet. If you are trading a format with a hard stop, giving it a little room past the wick is usually worth the extra risk. Second, if the invalidation distance is so wide that the position size becomes uncomfortable, the trade is too big, not the stop too wide. Cut the size or pass. The arithmetic behind that is in risk management for binary trading.
A worked example
GBP/USD on 15 minutes. The pair spent the Asian session between 1.2610 and 1.2632. London opens and price pushes down to 1.2604, below the session low, then closes the candle back at 1.2613. That is a sweep of the obvious low with a close back inside the range.
The next candle opens at 1.2613 and closes at 1.2629. The previous candle's body ran from 1.2622 down to 1.2613, so this body covers it completely. Bullish engulfing, at the edge of a range that held all session, immediately after the low below it was taken.
Now grade it. Level: the range low, tested multiple times overnight. Previous body: modest, which is a minor mark against it. Close position: 1.2629 against a high of 1.2631, so the close is right at the top of its range. Trend: neutral, since this is a range rather than a trend, which is acceptable for a range reversal. Liquidity: taken, one candle earlier. Invalidation: 1.2604, the sweep low, which is 25 pips below the close.
Five clean marks out of six, and a defined invalidation. That is a normal size trade. The 25 pip invalidation distance is what decides the size, not the other way round.
Change one thing and the grade collapses. If the same engulfing candle had printed at 1.2620, in the middle of the overnight range with nothing swept, it is the same shape and a completely different trade.
Why do engulfing candles fail?
Engulfing in the middle of a range
The candle in that diagram passes every rule. It opens below the previous close, closes above the previous open, and closes in the top of its own range. It also fails immediately, because it printed in open air. No level, no defended price, no reason for anyone to step in there.
This is the most common losing engulfing trade there is, and the filter is one question: what level is this reacting to?
Engulfing a doji or a tiny body
If the previous candle had almost no body, the engulf reversed almost nothing. Screeners produce a lot of these. Require a previous body with real size relative to the recent candles.
Engulfing right at a session open
When London or New York opens, the first candles are often wide and violent. A bearish engulfing candle formed in the first minutes of a session can be an artefact of the volume arriving rather than a reversal read. Either wait for the session to settle or treat the first candles as information about range rather than direction. Session timing is covered in forex pairs and trading sessions.
Engulfing against a strong momentum run
Three or four wide bodies in one direction, then one engulfing candle the other way, is usually profit taking. The trend has not made a lower high yet, nothing structural has broken, and one candle is not a reversal.
Wait for the structure to change: a failure to make a new extreme, then a break of the last pullback level. Then an engulfing candle in the new direction means something.
Engulfing on the 1 minute chart in dead hours
A 1 minute engulfing candle at 3am on AUD/CAD may be built from a handful of ticks. The shape is real, the information behind it is not. If you trade that window, widen the timeframe you read from.
Patterns that get confused with engulfing
Piercing line and dark cloud cover
A piercing line closes above the midpoint of the previous red body but does not clear its open. A bullish engulfing candle clears the open.
Dark cloud cover is the same idea at a top: open above the previous close, close below the midpoint of the previous green body, but not below its open.
Treat both as partial versions. Same logic, less of it. They earn a trade when the location is excellent and the rest of the checklist is clean, and they are easy to pass on otherwise.
Harami: the opposite of engulfing
A harami is the inverse relationship. Instead of the new candle covering the previous body, the new candle sits entirely inside it.
The reading is range contraction. The previous period pushed hard and the next period produced nothing at all, not even a test of the extremes. That is a stall, not a reversal. What matters next is which side of the small candle breaks, so a harami is best used as a signal to wait rather than a signal to enter. The doji version of the same message is covered in doji candlestick patterns.
Tweezer tops and bottoms
A tweezer is two adjacent candles sharing almost the same extreme with opposite closes. It is not an engulfing pattern, because the second body does not need to cover the first, but it carries similar information: price reached one specific price twice and was turned away both times.
Tweezers are easy to spot and easy to over-trade, because matched highs and lows appear constantly in ranges. The filter is the same one as always: the matched price has to matter on the higher timeframe. Two candles sharing a low in the middle of a chop range is chop, not a setup.
Engulfing candles on short binary expiries
Binary trades close on a clock. There is no partial exit and no way to be right slowly, which changes how the pattern should be used.
- Read the level on a higher timeframe. Mark levels on 15 minutes or 1 hour, then look for the engulfing candle when price arrives.
- Match the expiry to the candle timeframe. A 5 minute engulfing candle is saying something about the next few 5 minute candles. A 15 second expiry on it is a different bet.
- Wait for the close. The pattern is not a pattern until the candle closes. Entering mid-candle because it looks like it will engulf is a guess about where the close will land.
- Take the trend-side ones. With a fixed payout and no ability to scale out, the marginal counter-trend setup is where accounts leak. Skipping it costs nothing.
Expiry selection deserves its own thinking, and it is covered in binary options expiry times explained.
Reading engulfing candles on OTC pairs
OTC pairs run on their own feed, which means the chart for EUR/USD OTC is not the same chart as Live EUR/USD. The prices are related, the rhythm is not identical, and that has two practical consequences for this pattern.
First, mark your levels on the OTC chart you are trading. Taking a level from the Live forex chart and applying it to an OTC chart is how traders end up waiting at a price that means nothing on the screen in front of them.
Second, the range size and typical wick behaviour on an OTC pair need their own calibration. Spend time watching one OTC pair on one timeframe before trading it, and note how big a normal body is and how far wicks usually extend. A body that would be large on Live EUR/USD 1 minute may be ordinary on an OTC chart, and an engulfing candle is judged relative to its neighbours.
The platform differences are worth knowing too, since the pair lists, the timeframe options and the payout structures are not identical. Quotex trading guide lays that out.
How REDBERRY reads this kind of structure
REDBERRY is a non-profit informational signal desk for Quotex. It is not a broker, it does not hold funds, and it does not place trades. You decide every position.
For Live pairs the desk uses the TradingView API for realtime price and chart structure, so the algorithm can read the market as it prints, then inbuilt strategies work out the next likely move. For OTC pairs it uses private Quotex API access for a live OTC price feed, with the same inbuilt strategies on top. Body and wick relationships are part of what any price based method reads, so learning to grade an engulfing candle by hand is not wasted effort even when you are taking desk signals.
Signals are not 100% accurate. Nothing gets a guaranteed read on the next candle. What reading candles yourself gives you is the ability to tell a clean chart from a chop range, and that changes how much risk a position deserves. The process is described in how REDBERRY generates Live and OTC signals.
Grading checklist
| Check | Strong | Weak |
|---|---|---|
| Body engulf | Closes past the previous open | Only wicks cover it |
| Previous body | Wide, real selling or buying | Doji or tiny body |
| Level | Tested price, range edge, flip level | Middle of the range |
| Close position | Top or bottom fifth of its range | Middle of its range |
| Trend | With the higher timeframe | Against a strong run |
| Liquidity | Follows a sweep of a high or low | No sweep, no reaction |
| Invalidation | Named price, size fits it | Not defined before entry |
Five or more strong marks with a defined invalidation is a normal size trade. Three is half size or a pass. One is not a trade, it is a shape you noticed.
For the wider map of how this pattern sits next to the rest, the complete guide to candlestick patterns covers single, two and three candle shapes side by side, and morning star and evening star patterns covers the three candle version of the same takeover logic.
Questions people ask
What is the exact rule for a bullish engulfing candle?
The previous candle must be red. The current candle must open at or below the previous close and close above the previous open, so its body fully covers the previous body. The wicks do not need to be engulfed. If the body does not clear the previous open, it is not an engulfing candle, whatever the range looks like.
Does an engulfing candle need to engulf the wicks too?
No. The standard definition is body to body. A candle that also covers the previous high and low is a stronger version of the same thing and is sometimes called an outside bar, but the rule you check is the body. This matters because a candle with a very wide range and a small body can look like it engulfs everything while actually showing indecision.
Where do you enter a bullish engulfing pattern?
Three usual options. At the close of the engulfing candle, which gets the best price but no confirmation. On a break above the engulfing candle high, which confirms continuation but pays more. Or on a pullback into the engulfing candle body, which gets a good price but sometimes never fills. The invalidation is the same in all three cases: the low of the engulfing candle.
Why do engulfing candles fail so often?
Because most of them print where nothing is happening. A valid engulfing candle in the middle of a range has no level behind it and no reason for anyone to defend that price. Filter by location first and a large share of the failures disappear along with a large share of the signals.
What is the difference between engulfing and a piercing line?
Amount. A piercing line closes above the midpoint of the previous red body but below its open. A bullish engulfing candle closes above the previous open entirely. Same logic, less of it, so treat the piercing line as the weaker version and demand better location before taking it.
Do engulfing candles work on 1 minute charts for binary trades?
They appear on every timeframe, but a 1 minute engulfing candle in a quiet hour can be formed by very little trading. For short expiries, use a 15 minute or 1 hour chart to pick the level and direction, then look for the engulfing candle on the lower timeframe as a timing trigger rather than as the reason for the trade.
Nothing here is financial advice. Signals and setups can be wrong, so only risk money whose loss will not change your life.