Hammer and Shooting Star Candles: Rules and Ratios
Hammer and shooting star candles explained: wick to body ratios, where each must appear, hanging man and inverted hammer, and why lone hammers fail.
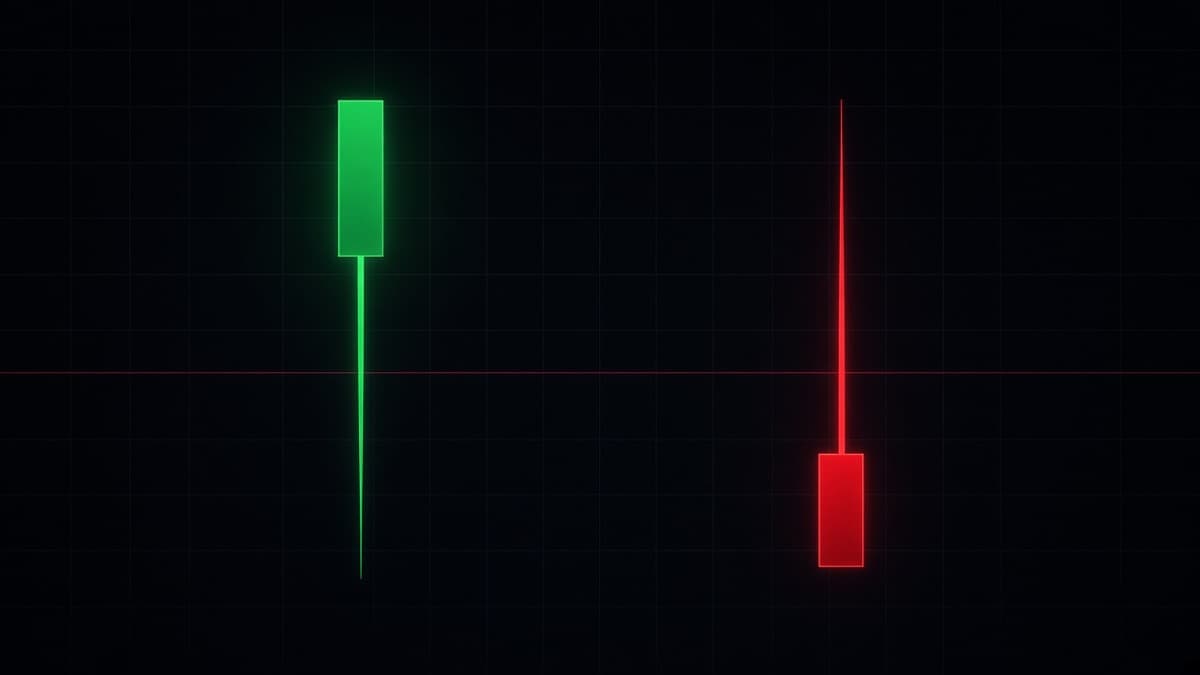
A hammer is not "a candle with a long tail". It is a candle where the lower wick is at least two thirds of the total range, the body sits near the high, the upper wick is small, and all of that happens after a decline into a price that already mattered. Miss any of those and you have a long tail and nothing else.
That last condition is the one that costs money. Traders learn the shape, find it everywhere, and take trades in the middle of ranges where no buyer had a reason to defend anything. This article covers the ratios, the location requirements, the two mirror patterns that use the same shapes, and the failure cases with diagrams so you can see what a losing version looks like.
The measurement that defines these candles
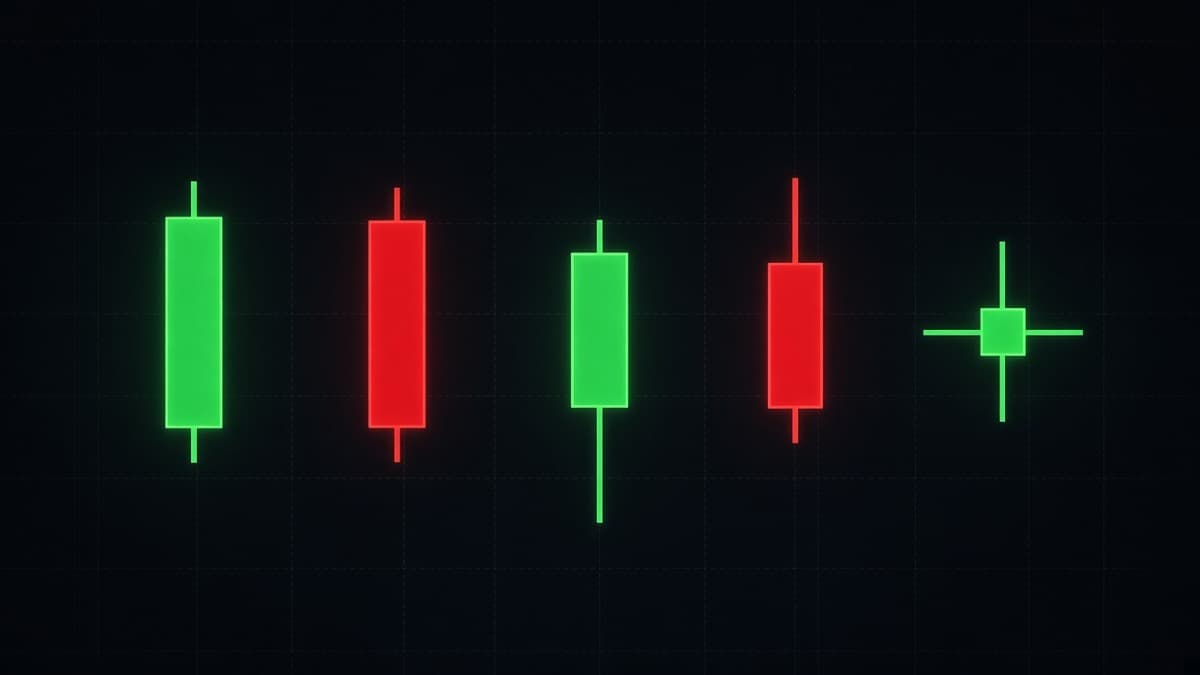
Both patterns are built from the same two measurements: how much of the range is body, and how much of the range is one wick.
The left candle qualifies. Total range 9.4, body 2.2, lower wick 6.6, upper wick 0.6. The lower wick is about 70 percent of the range and about three times the body. That is a hammer by any definition in use.
The middle candle does not. Range 7.4, body 2.4, lower wick 3, upper wick 2. The wick is barely longer than the body, and there is real length on both sides. That is closer to a spinning top: a period where both directions were tried and nothing was decided.
The right candle does not either. Range 12.6, body 2.2, lower wick 5, upper wick 5.4. Long wicks on both sides make it a long legged indecision candle, not a rejection candle. Those are covered in doji candlestick patterns.
Does the body colour matter?
Less than most people think. A hammer with a small red body still shows price being taken down and bought back within the same period, which is the whole message. A green body is marginally better, because the close finished above the open as well as near the high, but rejecting an otherwise clean hammer over its colour filters out good setups for no reason.
What does matter is where the body sits inside the range. A body in the top third of a hammer is what you want. A body in the middle, with real wick on both sides, is a different candle regardless of colour.
Two hammers at the same level
Worth more than one, usually. If price reaches a level, prints a hammer, drifts back down over a few candles, and prints a second hammer whose low sits at or just above the first one, the level has now been defended twice in view. The second low being higher is the useful detail, because it says sellers could not even reach the first price.
The invalidation in that case is the lower of the two lows, which is often further away. Size accordingly rather than moving the stop closer to make the position feel comfortable.
How to measure it in two seconds
You do not need to calculate percentages on a live chart. Use this instead.
- Can you fit the body into the long wick at least twice? If no, it is not a rejection candle.
- Is the other wick small enough to ignore? If both wicks are substantial, it is indecision.
- Is the body in the top third of the range, for a hammer, or the bottom third, for a shooting star?
Three yes answers and the shape qualifies. Now the real work starts, which is deciding whether the shape deserves a trade.
Hammer: where it must appear
The story inside a hammer is one period where sellers pushed price down and lost the move before the close. Price went to a price, somebody bought it in size, and the candle finished near its high.
Three conditions have to hold.
1. It comes after an actual decline. Not a sideways drift. The pattern is about a sell-off failing, so there has to be a sell-off. Four or five candles of real downward progress is the minimum context.
2. The wick reaches into a level. This is the condition people skip and the reason most hammers fail. The low of the wick should be at, or just through, a price that has already produced a reaction: a prior swing low, the bottom of a range that held before, a level that flipped from resistance to support.
3. The next candle confirms. Price holds above the hammer low, and preferably closes above the hammer body. A hammer followed by a candle that closes below the hammer low has failed, and the failure is usually fast.
Why the wick needs a level
Think about who has to be buying for a hammer to form. Somebody had to absorb every offer on the way down and keep buying until price came back up. That is size, and size does not arrive at random prices.
It arrives where there are resting orders, where a previous decision was made, or where stops have just been triggered and created the liquidity needed to fill a large position. When you see a hammer with a long wick, the question is not "is this a hammer". It is "what was down there".
If the answer is nothing, you are looking at a period where price wandered down and wandered back. That happens constantly and means nothing.
Why an isolated hammer means almost nothing
That candle is a textbook hammer. Small body near the high, lower wick around four times the body, minimal upper wick, and it comes after two red candles. It also fails immediately, and price goes on to make four more lower closes.
Nothing was wrong with the shape. The problem is that the level worth defending sat far below, and until price reached it, sellers had no reason to stop. The hammer marked one period where the selling paused. Pausing is not turning.
This is the single most useful thing to internalise about wick patterns. The wick tells you a price was rejected. It does not tell you the rejection will hold. Whether it holds depends on whether the price being defended is a price anyone else cares about.
A worked example
USD/JPY on 15 minutes. Price has been falling through the New York afternoon, five candles of steady lower closes, from 151.40 down to 150.85. Sitting at 150.72 is a swing low from the previous session that held twice.
The next candle opens at 150.86, trades down to 150.68, which is 4 pips through the old low, and closes at 150.84. Range 18 pips, body 2 pips, lower wick 16 pips, upper wick almost nothing. That is a hammer, and the wick went through a level that had already held twice.
Grade it. Decline into it: yes, five candles. Ratio: lower wick is nearly 90 percent of the range. Level: a twice tested swing low, and the wick took out the price just below it. Confirmation: still needed.
The next candle opens at 150.84 and closes at 150.99, above the hammer body. That is the confirmation. Invalidation is 150.68, the hammer low, 31 pips below the confirmation close.
Now change one detail. Suppose the hammer had printed at 151.10, with the old low still 38 pips below. Same shape, same ratios, same decline. But nothing had been swept, no level had been tested, and any buyer looking at that chart would rather wait for 150.72. That version fails, and it is the version most traders take, because it looks the same in a screenshot.
Shooting star: the mirror at the top
A shooting star has the same measurements inverted. Small body near the low of the range, upper wick at least two thirds of the total range, small or no lower wick, printed after a rally.
Buyers made a new high inside the period and lost the entire move before the close. If that high sits at a resistance level, or just above an obvious prior high where stop orders would have been resting, the candle is showing that the breakout attempt was absorbed by sellers.
The conditions mirror the hammer:
- It comes after a real rally, not a drift.
- The wick reaches a level or runs a prior high.
- The next candle holds below the shooting star high, and preferably closes below the body.
When a shooting star fails
The invalidation for a shooting star is a close above its high. In that diagram, the candle after the star does not break down. It holds, then the next candle closes above the star high, and the rally continues to a new high.
This is where traders lose more than they should. The short was taken on the star, the candle after it did not confirm, and instead of getting out at the first failed confirmation, the position was held through a close above the wick. Once price closes above the high of a rejection candle, the rejection did not hold. There is no version of the pattern that survives that.
Write the invalidation price down before entering. It is the high of the star, and it is not open to interpretation. Common binary trading mistakes covers how this specific failure compounds.
Hammer or hanging man: what is the difference?
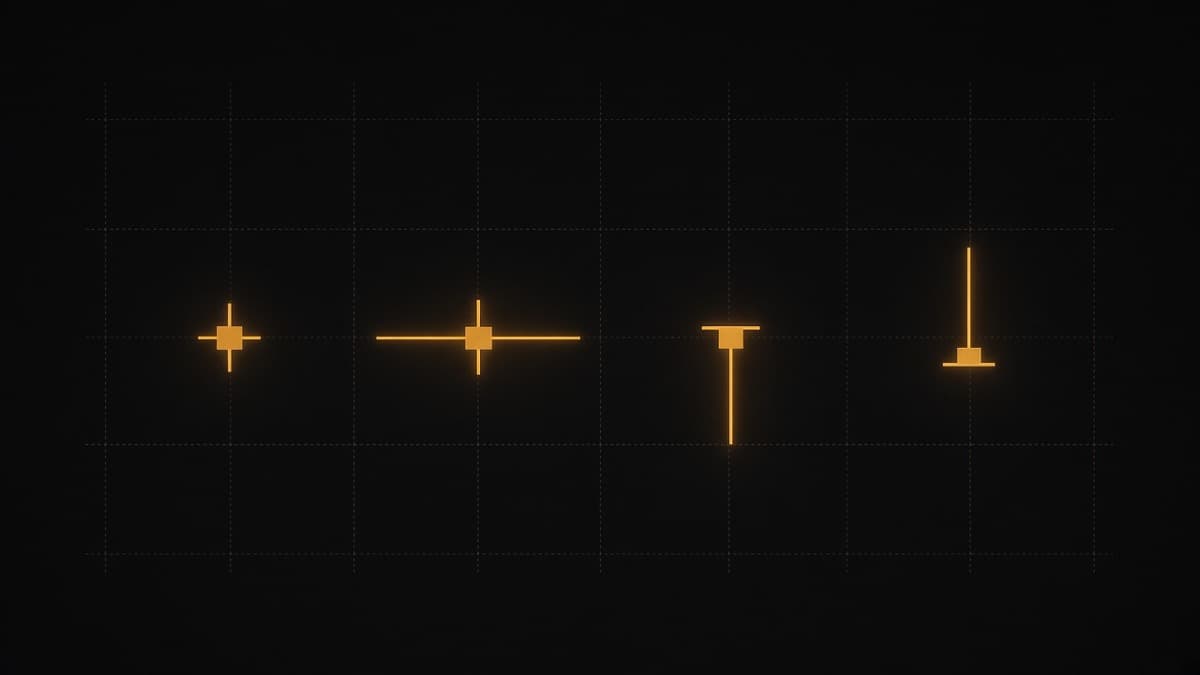
Four candle shapes exist here, and they are really two shapes in two locations.
Hanging man: the hammer shape at a top
Identical shape to a hammer. Small body near the top, long lower wick. It prints after a rally instead of after a decline.
Read the wick honestly. Price was up near the highs, and within one period sellers were able to drag it a long way down before buyers recovered the close. Buyers won the close, so the candle is not bearish on its own. What it tells you is that supply exists down there, which is new information after a run of clean green candles.
A hanging man is a warning, not a trigger. To trade it you need the next candle to close below the hanging man body, and ideally below its low. Without that, you are shorting an uptrend because one candle had a tail, which is the same error as buying a hammer in the middle of a downtrend.
Inverted hammer: the shooting star shape at a bottom
The weakest of the four, because the candle closes near its own low. Buyers pushed price up during the period and could not hold any of it. On its own that is not a bullish reading.
What makes an inverted hammer worth watching is what happens next. If the following candle closes strongly above the inverted hammer high, the sequence reads as an attempt that failed, followed by an attempt that worked. If the following candle closes below the inverted hammer low, the downtrend simply continued and the candle was a pause.
There is one version that carries more weight. If price has just swept a prior low, that low is holding, and the inverted hammer's upper wick pushes back into the broken level, you are watching an attempt to reclaim lost ground. That is a sequence, and sequences beat shapes.
Location gives the shape its name
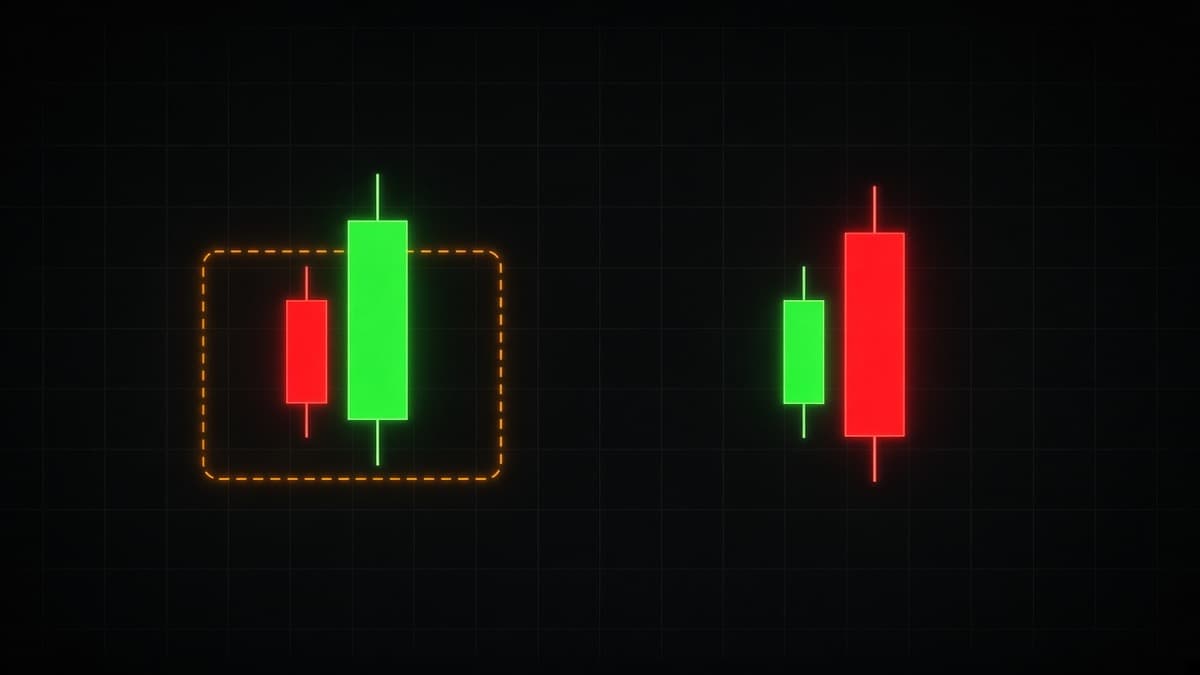
Both marked candles in that diagram have nearly identical proportions. The first one is called an inverted hammer and reads as a possible bottom. The second is called a shooting star and reads as a possible top. Nothing about the candle changed. Only what came before it.
If you take one idea from this article, take that one. These patterns do not have meanings. They have meanings in context.
Hammers after a liquidity sweep
The best hammers usually appear right after price has run through an obvious low.
The sequence is worth understanding rather than memorising. Equal lows sit on the chart, visible to everyone. Stop orders accumulate just under them, because that is the logical place for anyone long to protect a position. Price pushes through, those stops trigger as market sell orders, and that flow of selling is exactly what a large buyer needs to fill a position without moving price against themselves.
The candle that prints looks like a hammer. The wick is the sweep, the close back inside the range is the absorption, and the low of that candle becomes a reference point that price should not revisit if the read was correct.
That is why "the wick reached a level" is not a superstition. It is a description of where the orders were. Liquidity sweeps and stop hunts goes into the mechanics, and smart money concepts covers the wider framework.
Dragonfly: the extreme version
A dragonfly doji is a hammer with no body at all. Open and close are the same price, at the top of the range, with a long lower wick.
Read it the same way you read a hammer, with one adjustment. Because there is no body, there is no measure of how strongly the close was held. The candle recovered everything and then stopped exactly where it opened. That is slightly less convincing than a hammer with a real green body, and it needs the same confirmation from the next candle. The gravestone version at a top works identically in reverse, and both are covered with the rest of the family in doji candlestick patterns.
When does a hammer actually work?
Rejection candles are not equally useful in every condition, and knowing which condition you are in saves more money than refining the ratio rule.
Range bound markets. This is where hammers and shooting stars do their best work. The range edges are known, price keeps returning to them, and each return produces a rejection candle at a price with a history. Both edges are tradeable, and the invalidation sits just outside the range.
Trending markets. Take only the trend-side pattern. In an uptrend, hammers at pullback lows are continuation entries with the flow behind them. Shooting stars in that same uptrend are usually just a pause, and shorting them means fighting the direction of every larger participant on the chart.
Expanding volatility. When ranges are widening candle by candle, wicks get long everywhere and the ratio test stops filtering anything. In that condition, require the level to be excellent and accept fewer trades.
Dead hours. Very low activity produces shapes without substance. A 12 pip wick on a pair that has moved 20 pips in three hours is not a rejection, it is a thin book. Note the hour before you read the candle.
The rule underneath all four: the pattern is a trigger, and the condition decides whether the trigger is connected to anything.
Entry and invalidation
For all four patterns the invalidation is the extreme of the pattern candle.
| Pattern | Direction | Invalidation | Confirmation |
|---|---|---|---|
| Hammer | Long | Close below the hammer low | Next close above the hammer body |
| Inverted hammer | Long | Close below its low | Next close above its high |
| Shooting star | Short | Close above the star high | Next close below the star body |
| Hanging man | Short | Close above its high | Next close below its body |
Entry has the same three options as any candle pattern. At the close of the pattern candle, which is the best price with no confirmation. On the break of the pattern candle's body or high, which pays more for evidence. Or on a retrace into the body, which is efficient when it fills and misses the fast moves when it does not.
One warning specific to wick patterns. The extreme of a hammer or shooting star is the most obvious price on the chart, which makes it the most crowded stop location on the chart. If you are trading a format with a hard stop, placing it one pip past the wick means being stopped out regularly on moves that later work. Give it room, and take the size down to compensate. The arithmetic for that trade-off is in risk management for binary trading.
On short binary expiries
Wick patterns are awkward on very short expiries for one reason: they are only complete at the close, and the information they carry is about the next few candles of the same size, not the next few seconds.
Three adjustments that help.
Read the level on a higher timeframe. Mark the levels on 15 minutes or 1 hour. Then wait for price to arrive at one and watch for the rejection candle.
Match the expiry to the candle. A hammer on a 5 minute chart is describing the next few 5 minute candles. A 15 second expiry taken from it is a different bet with a different probability, whatever the pattern said. Binary options expiry times explained works through the matching.
Do not enter mid-candle. A candle that currently has a long lower wick may close as something else entirely. Half formed hammers become wide red bodies all the time.
How REDBERRY reads wick structure
REDBERRY is a non-profit informational signal desk for Quotex. It is not a broker, it does not hold funds, and it does not place trades for anyone.
Live pairs use the TradingView API for realtime price and chart structure, so the algorithm can read the market as it prints, and inbuilt strategies then work out the next likely move. OTC pairs use private Quotex API access for a live OTC price feed, with the same inbuilt strategies. Wick and body relationships are part of what any price based method reads, because they are the raw record of what happened inside each period.
Signals are not 100% accurate, and nothing has a guaranteed read on the next candle. What learning this by hand gives you is judgement about the chart in front of you. A desk signal arriving while price is in a tight chop range and a desk signal arriving while price is rejecting a level you marked an hour ago are not the same situation, and your position size should reflect that. How REDBERRY generates Live and OTC signals describes the process.
Quick summary
- A hammer is a lower wick of at least two thirds of the range, small body near the high, after a decline, into a level.
- A shooting star is the same with the wick on top, after a rally, at a level.
- A hanging man is a hammer at the top of a rally, and it is a warning that needs a lower close to become a signal.
- An inverted hammer is a shooting star at the bottom of a decline, and it is the weakest of the four.
- The wick tells you a price was rejected. The level tells you whether the rejection will hold.
- The invalidation is the extreme of the pattern candle, and it is also where everyone else keeps their stop.
For how these fit alongside the two and three candle patterns, the complete guide to candlestick patterns puts them in order, and bullish and bearish engulfing candles covers the takeover patterns that often follow a good hammer.
Questions people ask
What is the wick to body ratio for a valid hammer?
The usual working rule is that the lower wick should be at least two thirds of the total candle range, which puts it around twice the body or more. Many traders want three times the body. The upper wick should be small or absent. Treat the numbers as a screen rather than a law, because the proportions matter less than whether the wick reached a level that mattered.
What is the difference between a hammer and a hanging man?
Only the location. Both have a small body near the top of the range and a long lower wick. A hammer prints after a decline and reads as buyers absorbing supply. A hanging man prints at the top of a rally and reads as sellers being able to reach deep into the range during one period. Same shape, opposite meaning, and the hanging man needs a lower close after it before it means anything at all.
Is a pin bar the same as a hammer?
Close enough for practical purposes. Pin bar is the name used in a lot of price action material for any candle with a small body and one dominant wick. Hammer, hanging man, shooting star and inverted hammer are all pin bars by that definition. The naming differs, the reading does not.
Why did my hammer fail?
The most common reason is that it printed without a level underneath it. A hammer in the middle of a falling range has a long tail and nothing else. The second most common reason is that the trend was still strong, so the candle was a pause rather than a turn. The third is the stop: a lot of hammers work eventually but take out the obvious low first, because that is where every stop is sitting.
Does a hammer have to be green?
No. The body colour matters much less than the wick and where the body sits. A hammer with a small red body still shows price being taken down and bought back inside the same period. A green body is marginally better because it means the close finished above the open, but do not reject a valid hammer over its colour.
How do I trade a shooting star on a short expiry?
Use a higher timeframe to find the level the wick is rejecting from, wait for the candle to close, then take the direction on a lower timeframe with an expiry that matches the candle you read. A shooting star on a 5 minute chart is describing the next few 5 minute candles, so a very short expiry on it is a different bet from the one the candle described.
Nothing here is financial advice. Signals and setups can be wrong, so only risk money whose loss will not change your life.