Liquidity Sweeps and Stop Hunts Explained
Liquidity sweeps explained: where resting orders sit, how to read the sweep wick, equal highs and lows, and how to tell a sweep from a real break of a level.
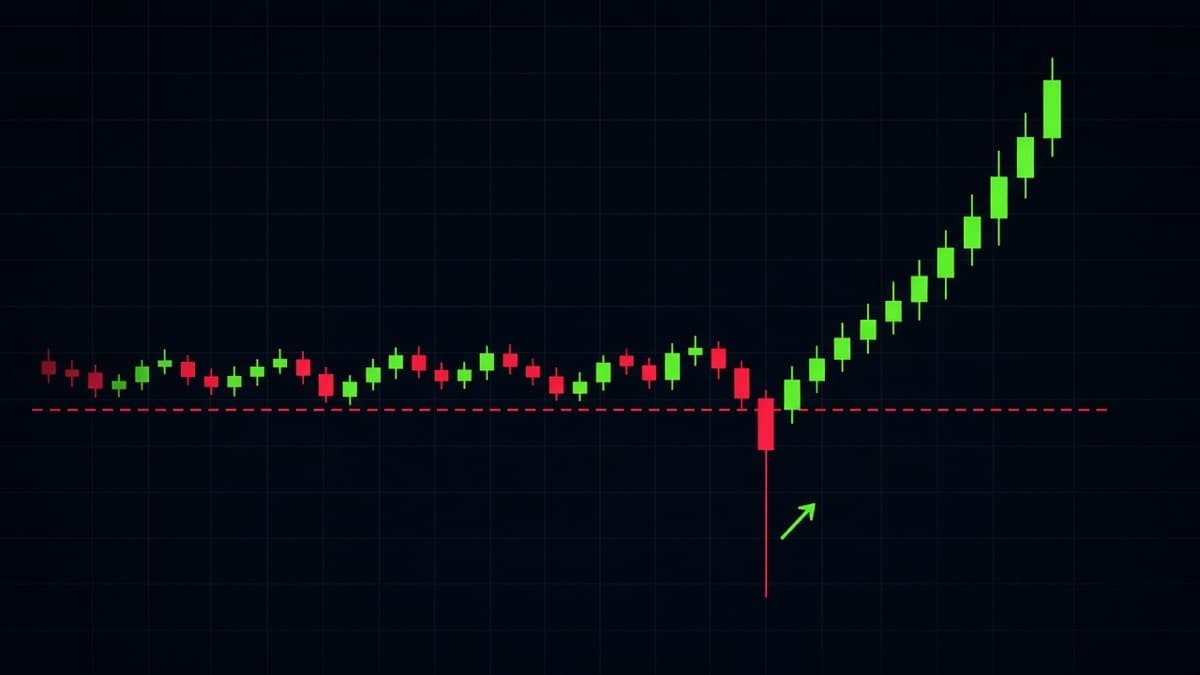
A liquidity sweep is a move that pushes past an obvious high or low and immediately comes back. On the chart it is a wick. The level it went past is the interesting part, because that is where orders were sitting.
This is the single most useful idea in smart money concepts for short timeframes, and the reason is boring rather than exciting: it gives you an invalidation level the market drew for you. If price swept the low at 1.0804 and you are long, you are wrong below 1.0804. No interpretation needed.
What is a liquidity sweep?
Three things have to happen for it to count.
- Price trades beyond a level that a lot of people can see.
- It does not stay there. The candle closes back on the original side.
- Price then moves away from the level in the opposite direction.
If only the first thing happens, that is a breakout. If the first two happen and price then chops sideways at the level, that is nothing. You need all three.
The word "liquidity" here means resting orders. Stop losses, breakout entries, limit orders, all of them sitting unfilled waiting for price to reach them. They are not spread evenly across the chart. They bunch up in a handful of very predictable spots.
Where liquidity actually sits
Six places, in rough order of how obvious they are.
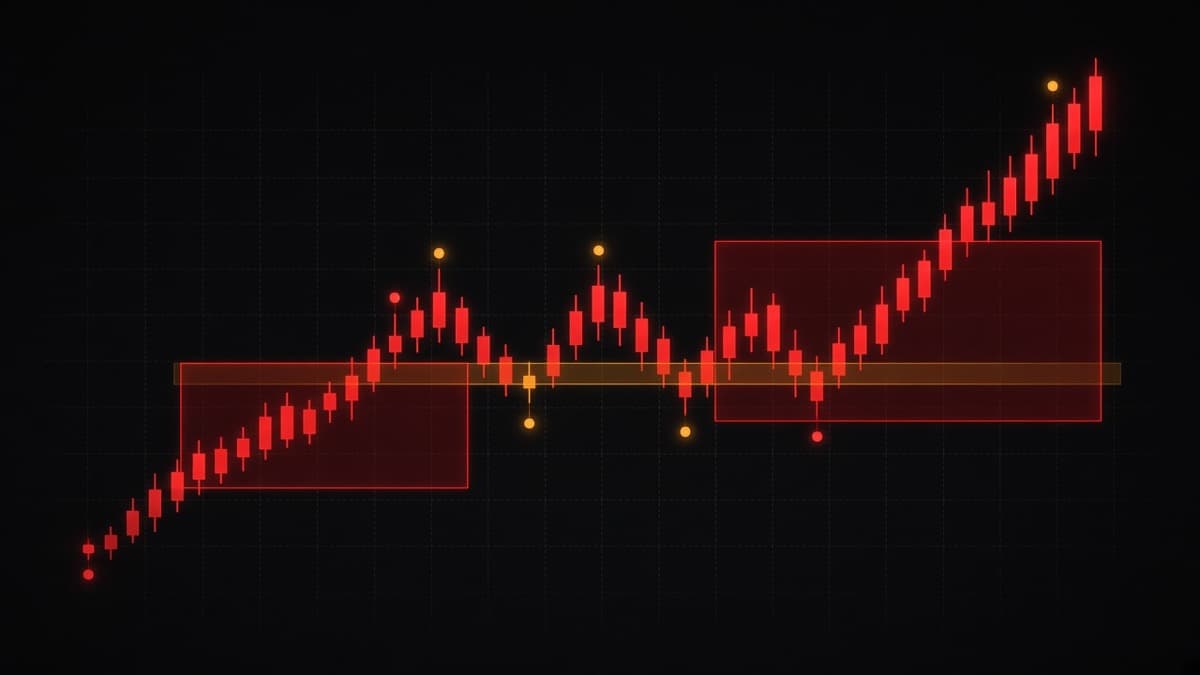
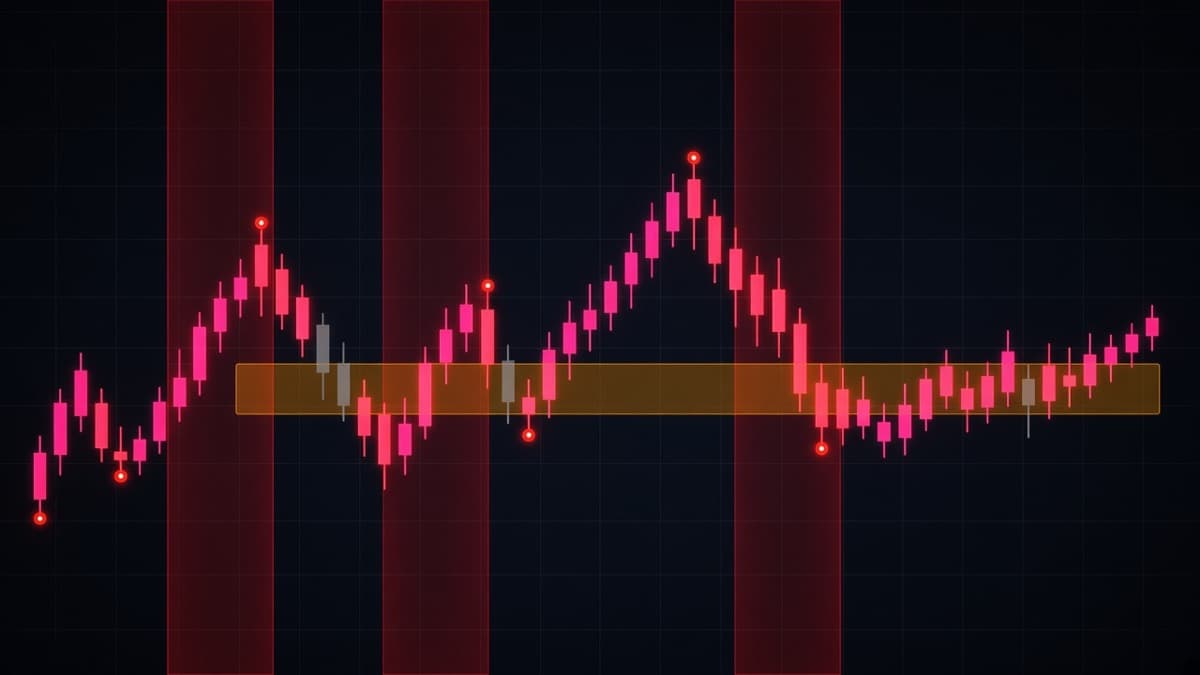
Just beyond equal highs or equal lows. Two or three swings finishing within a pip or two of each other create a shelf that everyone can see. Most reliable.
Just beyond a single obvious swing high or low. Anyone long from the last pullback has a stop under that low. Anyone waiting for a breakout has a buy order over that high.
Under a trendline. Everybody draws the same line through the same three lows, and everybody puts stops just under it.
Round numbers. On EUR/USD, 1.0800 and 1.0850 hold far more resting orders than 1.0837. On USD/JPY, 150.00 and 151.50.
Previous day high and low. The most watched horizontal levels in intraday forex after the session extremes.
Asia session high and low. For anyone trading the London open, these are the two lines on the chart.
The shorthand you will see: buy-side liquidity sits above highs (because the orders there are buy orders, either breakout entries or stops from short sellers) and sell-side liquidity sits below lows. It reads backwards the first few times. Buy-side is above, sell-side is below.
Why price goes there, and what that claim is worth
Be careful with this part, because it is where the teaching around sweeps goes furthest past what anyone can show.
What you can observe on any chart: price frequently reaches obvious levels, trades slightly past them, and reverses. This is not controversial and you can verify it yourself on any pair in an afternoon.
A reasonable explanation: a cluster of resting orders at one price is a place where a large participant can get filled without pushing price as far. If you need to buy a lot, you buy where sellers are being forced to sell, and forced selling happens when stops trigger. That is an argument about where liquidity is available. It does not require anyone to know who you are or what your position is.
What is not established: that banks or brokers identify individual retail stops and deliberately target them. On an exchange-traded or interbank instrument, nobody can see your stop loss. The phrase "stop hunt" is a useful label for a chart behaviour and a bad description of an intention you cannot verify.
There is one honest caveat. On some over-the-counter products, the counterparty does have more visibility into client positioning than an exchange participant would. That is a real structural difference and it is worth being aware of. It still does not turn the observation into proof of targeted hunting, and you should not build your trading around a theory you cannot test.
Trade the behaviour. The behaviour is real and repeatable. The story about intent adds nothing to the trade and makes it harder to stay objective when you are wrong.
Equal highs and equal lows
These deserve their own section because they are the highest quality version of the setup.
Equal highs are two or more swing highs that finish at almost the same price. Not exactly the same, usually within a pip on EUR/USD or two or three pips on GBP/JPY. What matters is that they look level on the chart.
Why they matter more than a single high: a single high is one reference point. Three highs at the same price is a shelf that anyone looking at the chart will use. That concentrates orders in a narrower band, which makes the sweep sharper and the reversal cleaner.
You already know this pattern under another name. Equal highs followed by a failure to hold above them is a double top. The classical version waits for the neckline break to confirm. The sweep version enters earlier, right after the wick, using the wick high as invalidation. Earlier entry, tighter invalidation, lower hit rate. Pick your trade-off.
Practical notes:
- Three equal highs is better than two.
- Highs formed in different sessions are better than three formed in twenty minutes.
- The longer the shelf has been sitting there untouched, the more orders have had time to build behind it.
The sweep wick
The wick is the whole signal, so it is worth being precise about what a good one looks like.
Length. It should be visibly longer than the wicks on the surrounding candles. A 2 pip poke through a level on EUR/USD 5m is ambiguous. An 8 pip spike that closes back is not.
Close position. The candle should close well back inside the range, ideally in the opposite half from the wick. A candle that wicks below the low and closes right at the low has not rejected anything.
Speed. The whole thing should happen inside one or two candles. Price dipping below the level and spending six candles down there before coming back is a different event and a much weaker one.
The candle shapes this produces are the ones covered in hammer and shooting star. A sweep of lows very often prints a hammer. A sweep of highs very often prints a shooting star. If you already read candles, you have been trading sweeps without the vocabulary.
One thing to watch for on the fast pairs: on GBP/JPY, a sweep wick can be 30 pips. That looks alarming if you were already positioned. It is why the sweep is something you wait for rather than something you anticipate.
Sweep versus a genuine break
This is the question that costs money, so take it slowly.
A sweep: wick past the level, close back inside, on the timeframe you are analysing.
A break: close beyond the level, and then the next pullback holds on the new side instead of falling back in.
The two tests that resolve most cases:
Test one, the close. Always judge on closes, and always on the timeframe where you marked the level. A 1m close above a 15m high means nothing. A 15m close above it is a break.
Test two, the retest. After the close beyond the level, price usually comes back to it. If it holds on the outside, the break was real. If it trades back inside and closes there, the break failed and you are back to a sweep, just a slower one.
Three more signs that lean toward a real break rather than a sweep:
- The break candle is larger than average and closes near its extreme.
- The break leaves a fair value gap behind it. That is the cleanest test for whether the move was fast enough to mean something, and the mechanics are in fair value gap explained.
- Several candles close beyond the level rather than one.
And three that lean toward a sweep:
- The move beyond the level happened in one candle and reversed in the same candle.
- Price had been sitting right under the level for a long time beforehand, coiling.
- The level was an obvious shelf of equal highs or lows rather than a single swing.
When you genuinely cannot tell, the answer is to wait for the retest. You will miss some entries. You will avoid a lot of the worst ones, which is the trade most people should be making. Getting this wrong repeatedly is on most lists of common binary trading mistakes for a reason.
Trendline liquidity
Diagonal levels work the same way as horizontal ones, and they are often cleaner because the drawing is so uniform.
If a rising trendline has three or four clean touches, a lot of traders are long from those touches with stops just below the line. The line keeps rising, so the stop cluster keeps rising with it. When price finally cuts down through the line, there is a concentration of sell orders right there.
What often happens next: price breaks the trendline, runs 15 or 20 pips, and then reverses hard back above it. The break was the sweep.
How to use this without getting chopped up:
- Do not trade the trendline break itself. Trade what happens after.
- If price breaks the line and immediately reclaims it with a close back above, that is a sweep of trendline liquidity and it is often a good long.
- If price breaks the line and the next few candles keep closing below, the trend is actually over. Stop looking for longs.
The same applies to descending trendlines in a downtrend, with everything flipped.
Session liquidity
Certain levels get watched by a huge number of intraday traders, which makes them reliable liquidity pools.
| Level | Who is watching it | Typical behaviour |
|---|---|---|
| Previous day high | Almost every intraday trader | Often taken during London or New York |
| Previous day low | Same | Same |
| Asia session high | London open traders | Frequently swept in the first hour of London |
| Asia session low | Same | Same |
| London session high | New York traders | Often revisited early in New York |
| Weekly high and low | Swing traders | Slower, bigger reactions |
The Asia range is the most useful of these for short-term trading. Asia is usually quiet, price builds a tight range, and then the London open expands it. Very often the first move out of that range is in one direction and the real move for the session is in the other.
That false first push has a name in ICT terminology, the judas swing, and it is covered in ICT trading concepts. You do not need the name. You need to know that the first thirty minutes of a session frequently produce a move that does not last, and that trading it at face value is expensive.
Which pairs move in which session matters here too. Sweeping the Asia high on USD/JPY at the Tokyo open is a different event from sweeping it at the London open. Forex pairs and trading sessions covers the timing side.
What happens after a valid sweep
The sequence you want has three parts, in order.
One, the sweep. Price takes the level and closes back inside. Now you know where you are wrong.
Two, displacement. A fast candle or two in the opposite direction that closes beyond the most recent minor swing against you. This is the confirmation. Without it, you have a wick and a hope. A sweep with no follow-through is often just price continuing in the original direction after a pause.
Three, the entry. The displacement leg leaves something behind: a fair value gap, or an order block at its base, or both. That is where you enter, not at the sweep itself.
The reason to wait for steps two and three rather than buying the wick: buying the wick means guessing that the sweep will produce a reversal. Waiting for displacement means the reversal has already started and you are joining it at a pullback. Fewer trades, better ones.
A concrete version. EUR/USD 5m, 08:20 UTC. Two lows at 1.0811 and 1.0812 from the Asia session. A candle drops to 1.0804 and closes at 1.0815. Sweep. The next candle runs from 1.0815 to 1.0829, closing above the small high at 1.0824. Displacement. Those candles leave a gap between 1.0816 and 1.0820. Enter at 1.0820 or the midpoint at 1.0818, invalidation below 1.0804.
Internal versus external liquidity
A distinction that clears up a lot of confusion about which level price will reach next.
External liquidity is beyond the current range: the swing high above you and the swing low below you. Those are the edges.
Internal liquidity is inside the range: the smaller highs and lows that formed while price was rotating, plus any unfilled gaps and untested zones.
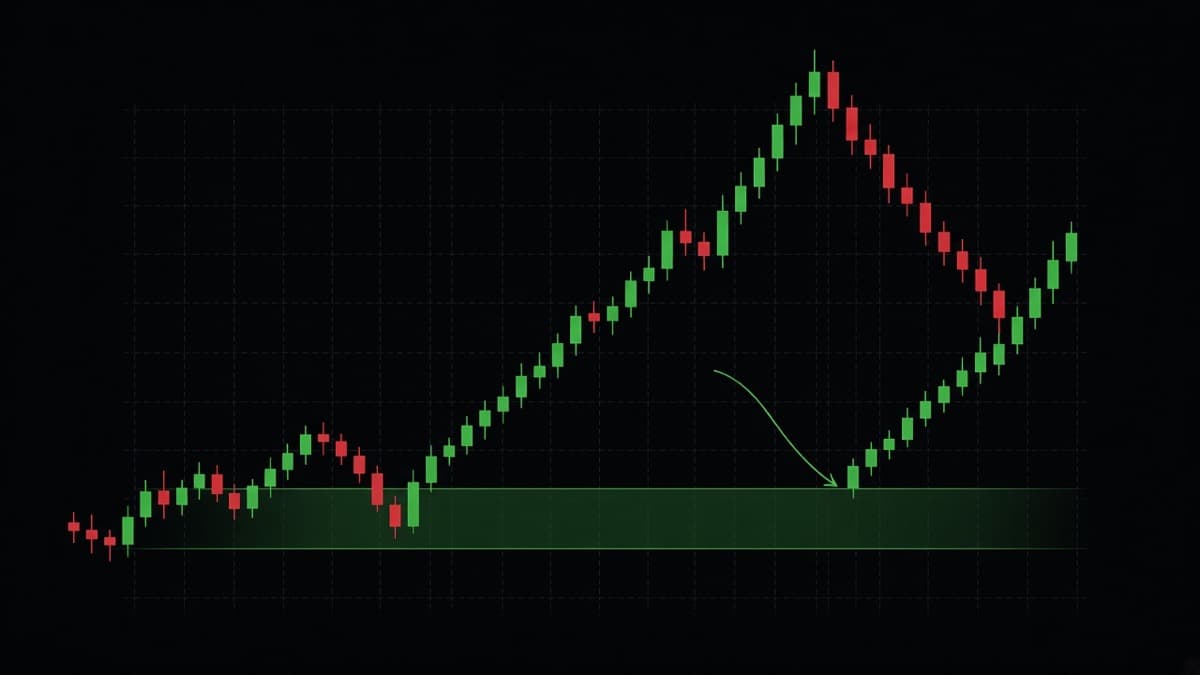
The general sequence is that price takes external liquidity on one side, then works through internal liquidity on the way to external liquidity on the other side. Sweep the low, then trade back up through the gaps and zones inside the range, then reach for the high.
Why this is useful: it tells you what to expect after a sweep. If price just swept the range low at 1.0811, the next real target is not the next 5 pip high. It is the range high at 1.0879, and everything in between is a stop on the way. It also tells you when a setup is low quality. A long taken in the middle of the range, after internal liquidity has already been cleared, has nothing obvious to run to.
The simple version: ask what the next obvious thing above and below price is. If the answer above is "a clean shelf 40 pips away" and the answer below is "nothing until 12 pips down," price will probably go down 12 first.
When both sides get taken
Sometimes price sweeps the high, reverses, and then sweeps the low too. This is common in ranges before a real move and it catches traders on both sides.
What it looks like on EUR/USD 5m: a 30 pip range between 1.0820 and 1.0850 that has held for three hours. At 12:10 price spikes to 1.0856 and closes back at 1.0844. Everyone reads that as a sweep of the highs and gets short. Forty minutes later price spikes to 1.0813 and closes back at 1.0826. Now the shorts are stopped out too.
After both sides are cleared, the range has nothing left holding it. The move that follows is often the real one, in whichever direction the second sweep pointed.
How to handle it: if the first sweep does not produce displacement within two or three candles, assume the other side is next. Do not keep re-entering in the same direction because the first read felt right. A range with both extremes taken is a different chart from a range with one taken.
A GBP/JPY example, start to finish
GBP/JPY because the moves are large enough to see everything clearly.
Context. The 1h is in an uptrend, making higher highs. The last higher low is 188.20. Current price 188.95. The range runs 188.20 to 189.40, so the midpoint is 188.80 and price is just above it. Marginally premium, so you would rather wait for a dip.
Liquidity. There are two 15m lows at 188.42 and 188.44 from the London session. Equal lows. That is the obvious pool below, and it sits above the structural low at 188.20.
What you expect. Price drifts down into the 188.42 shelf, takes it, and turns. That would be a sweep of internal liquidity inside the higher timeframe uptrend, which is the setup you want.
What happens. At 14:05 a 15m candle drops to 188.31 and closes at 188.51. The wick is 20 pips, which on GBP/JPY is normal and would have looked terrifying if you had a tight stop under 188.42.
Confirmation. The next 15m candle runs from 188.51 to 188.86, closing above the minor high at 188.74. That is displacement. It leaves a gap between 188.55 and 188.63.
Entry. In the gap, so somewhere between 188.55 and 188.63. Midpoint 188.59.
Invalidation. Below 188.31, the sweep wick. That is 28 pips from the entry, which sounds wide until you remember the pair moved 20 pips in a single wick ten minutes earlier. Sizing has to reflect the pair, not your preference.
Targets. 188.95 where price came from, then the range high at 189.40 where buy-side liquidity is resting.
The thing to take from this is not the numbers. It is that every decision was made from levels that existed before the trade, and the invalidation came from the market rather than from how much you felt like risking.
Failed sweeps: when the break was real
Plan for this properly, because it is the expensive case.
You see a wick through a low. You read it as a sweep. Price comes back up, you get long, and then price rolls over and takes the low again, this time closing below it. Now you are in a trade with no thesis.
What usually caused it:
The higher timeframe was already broken. Your 5m sweep happened inside a 1h downtrend that had just made a lower low. The sweep was a pause in a move that was going to continue.
There was no displacement. Price wicked the low and came back, but the recovery was three slow overlapping candles that never took out a minor high. That is not a reversal, it is a bounce.
You were the second sweep. The first sweep took the obvious lows. Price rallied 10 pips, then came back and took the sweep wick low too. If a level gets swept and price does not leave the area, the next move often takes the sweep low itself.
News. A release hit while price was near the level, and the technical read stopped applying for a few minutes.
The defence is mechanical: your invalidation goes beyond the sweep wick, and you honour it. The whole reason to trade sweeps is that the market gives you that level. If you move it, you have given up the only real edge in the setup. How much to risk per trade is a separate question and it matters more than the pattern does, which is the argument in risk management for binary trading.
Sweeps on OTC pairs
OTC pairs on Quotex are synthetic instruments generated by the platform's feed, not the interbank market. That matters for how you think about sweeps.
What still applies: the shape. Equal highs form, wicks push through them, and price reacts. That is visible and you can trade it.
What does not apply: the explanation. There is no pool of interbank stop orders sitting above an OTC high. Whatever produces the behaviour on that feed, it is not the same mechanism as spot forex.
The sensible approach is to use the pattern as pure price structure and drop the narrative entirely. Mark the equal highs, wait for the wick and the close back inside, wait for displacement, and take the entry. The reasoning about why it happens is not required for the trade to be taken, and on OTC it is probably wrong anyway.
Trading sweeps on short expiries
Sweeps are the part of the framework that fits fixed expiries best. Here is why, and where it still goes wrong.
Why it fits: the reaction to a sweep is fast. If a sweep is going to produce a reversal, it usually starts within one to three candles. That is a window a 1 to 5 minute expiry can capture.
Where it goes wrong:
- Entering on the wick. The wick is still forming when you see it. A 1m candle that is currently 6 pips below the low might close 6 pips below the low. Wait for the close.
- Expiry too short. You took the entry after the sweep candle closed, with a 1 minute expiry, and price spent that minute consolidating before running. Correct read, losing trade. Matching expiry to the setup is covered in binary options expiry times explained.
- Taking every wick. On a 1m chart there is a wick through something every few minutes. Only trade sweeps of levels that were obvious before the sweep happened. If you had not marked the level in advance, you are pattern-matching after the fact.
A workable discipline: mark two or three levels at the start of your session and only trade sweeps of those. Everything else is noise you are choosing not to trade.
Common mistakes
Calling every wick a sweep. A wick is only a sweep if it went past a level that mattered. Random wicks in the middle of a range are just candles.
Entering before the close. The candle is not a sweep until it closes back inside. Until then it is a break in progress.
No displacement requirement. A sweep followed by nothing is not a trade. Wait for the fast move against the sweep direction.
Moving invalidation past the wick. The sweep extreme is the level. If price trades there, you were wrong. Widening it because you do not want to be wrong is the most reliable way to turn a small loss into a large one.
Trading against a fresh higher timeframe break. If the 1h just closed below a major low with a big candle, the 5m sweeps on the way down are continuation pauses, not reversals.
Assuming somebody did it to you. It is a chart behaviour, not a personal attack. Traders who take it personally start revenge trading, and that costs more than any single setup.
How REDBERRY reads this
For context on the desk side: REDBERRY reads live market structure rather than asking you to mark levels by hand.
Live pairs use the TradingView API for realtime price and chart structure, and the inbuilt strategies work from that to predict the next move. OTC pairs use private Quotex API access for a live OTC price feed, with the same inbuilt strategies applied on top.
Signals are not 100 percent accurate, and no read on the next candle ever is. Understanding sweeps yourself is still worth the time, because it tells you when a signal is arriving right after an obvious level was taken and when it is pointing straight into one that has not been touched yet. REDBERRY is a non-profit informational desk, not a broker, and every trade decision stays with you. The feed details are in how REDBERRY generates Live and OTC signals.
A two week exercise
One pair, one session, fifteen minutes a day.
Before the London open, mark four levels on EUR/USD: the Asia high, the Asia low, the previous day high and the previous day low. Write the four prices down. Do nothing else.
Then watch the first two hours. For each of the four levels, note whether price reached it, whether it wicked through and closed back inside, and what happened in the twenty minutes after.
Ten sessions gives you forty observations on your pair at your hours. You will find out which of those four levels actually produces clean reversals for you and which one just gets broken. That is worth more than any general rule, because most of the general rules were written about a different pair at a different hour.
Questions people ask
What is a liquidity sweep?
It is a move that pushes past an obvious high or low and then comes straight back inside. On a candle chart it shows up as a wick. The level it passed is where stop orders and breakout orders were likely sitting, which is why the move went there and why it did not continue.
Do brokers and banks hunt stop losses?
Nobody can demonstrate that from a retail chart. What is observable is that price often reaches obvious levels, trades slightly past them, and reverses. The straightforward explanation is that resting orders cluster at obvious prices, so those prices are where size can get filled. That is a market structure argument, not a documented conspiracy.
How do I tell a sweep from a real breakout?
Look at the close, not the wick. A sweep wicks past the level and closes back inside on the timeframe you are watching. A real break closes beyond the level and then the next pullback holds outside it instead of falling back in. If you are unsure, wait for the retest.
What are equal highs and equal lows?
Two or more swing highs or swing lows that finish at nearly the same price. They stand out visually, which is exactly why orders build up just beyond them. They are among the most reliable places to expect a sweep.
Where should my invalidation go on a sweep trade?
Beyond the sweep wick. If price swept a low at 1.0804 and you are long, you are wrong below 1.0804. That clarity is the main practical benefit of trading sweeps, because the level is defined by the market rather than by your preference.
Do liquidity sweeps happen on OTC pairs?
The shape appears on OTC feeds and price does react to it. What does not carry across is the explanation about interbank orders, because OTC pairs are synthetic instruments rather than the real market. Use the pattern, not the story behind it.
Nothing here is financial advice. Signals and setups can be wrong, so only risk money whose loss will not change your life.