Order Blocks Explained: How to Mark and Trade Them
Order blocks explained candle by candle: the last opposing candle rule, bullish and bearish zones, refining, breaker and mitigation blocks, failed retests.
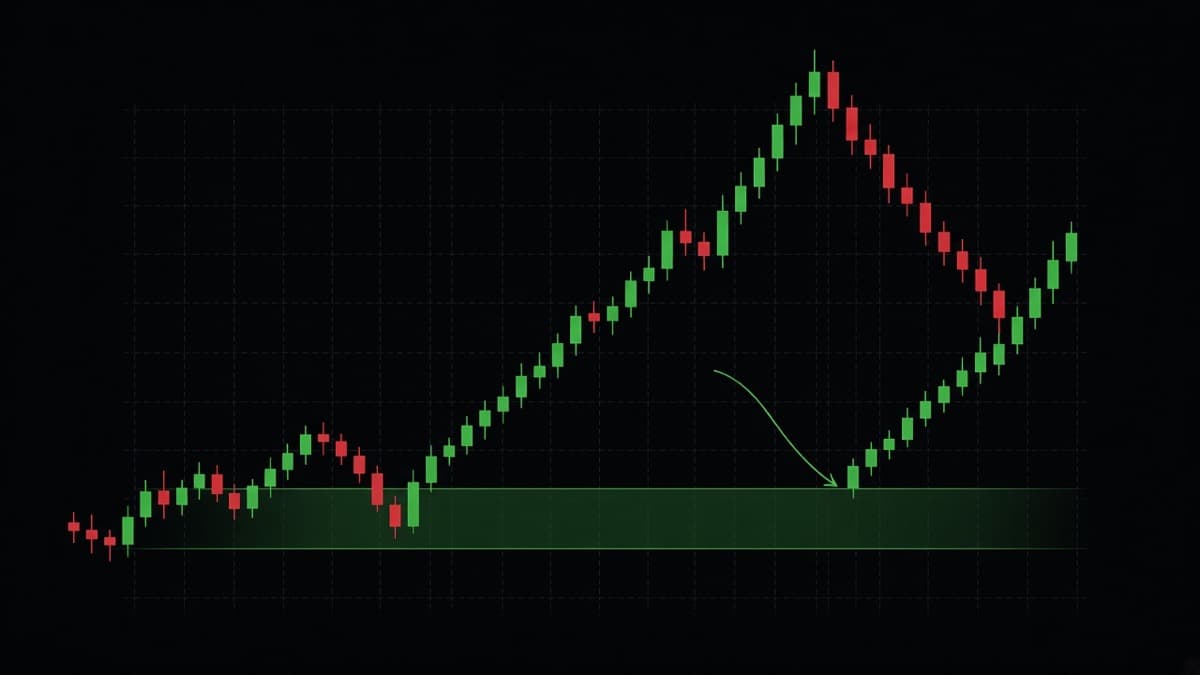
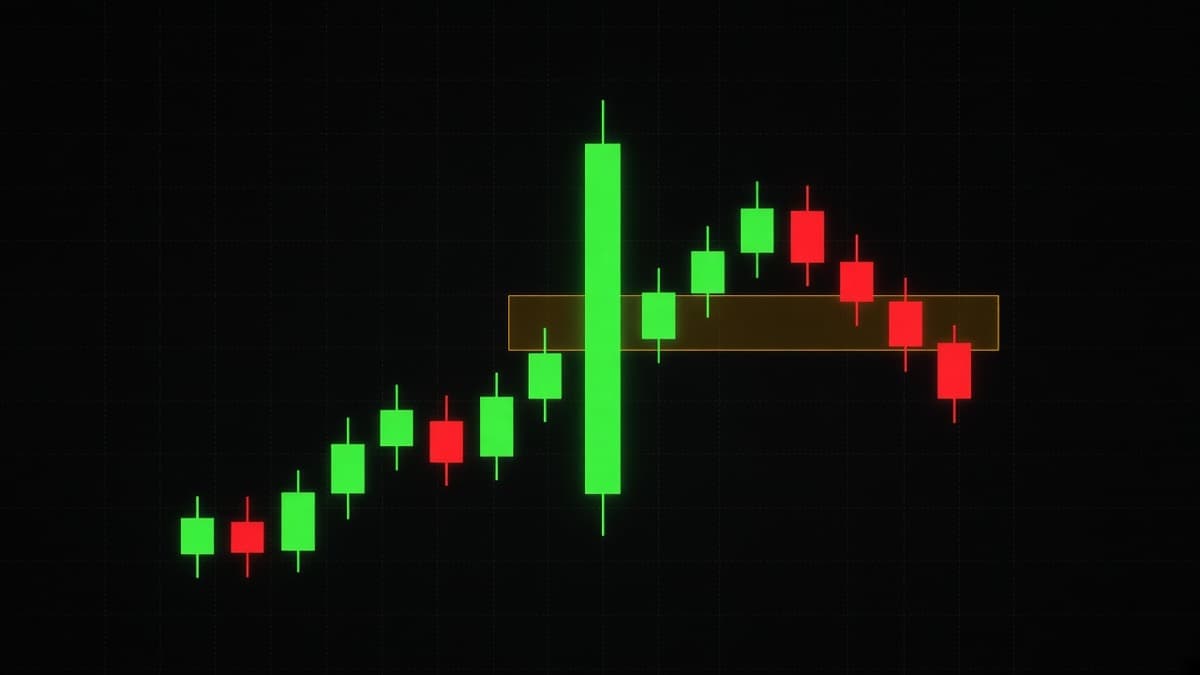
An order block is the last opposing candle before a move that breaks market structure. That is the whole definition. Everything else in this article is about which ones to trust, how to narrow the zone down, and what to do when price cuts straight through.
If you have not read the wider framework yet, start with smart money concepts, because an order block without structure around it is just a candle you drew a box on.
What is an order block?
Price rarely moves in a straight line. It drifts, then it goes. An order block marks the candle right before it went.
The reasoning goes like this. If price was sliding down and then ran hard through a swing high in the next two candles, something changed in that small area. Large orders do not fill in one tick, so the argument is that unfilled interest is still sitting at those prices. When price returns, that interest gets picked up and the move continues.
That is a reasonable story. It is not something you can verify from a retail chart, and you should hold it lightly. The reason to use order blocks anyway is practical: they give you a small zone with a defined edge instead of a vague area. On EUR/USD 15m, an order block is typically 5 to 9 pips wide. A guess at "support around here" is 25 pips wide. The narrow one is a better trade structure even when both are wrong.
How to find a bullish order block
Four steps. Do them in this order, every time.
- Find a break of structure to the upside. Price must close above a previous swing high. Not a wick through it. A close.
- Walk back to where that move started. Follow the impulse leg back down to the point where the up move began.
- Find the last down candle before it. That is your order block. If there are two down candles in a row, use the last one. If the move started from a small doji, use the last candle with a lower close than its open.
- Mark the high and the low of that candle. That is your zone.
A concrete version. EUR/USD 15m. There is a swing high at 1.0862. Price is drifting down, prints a red candle from 1.0836 down to 1.0831, and then the next candle runs from 1.0831 to 1.0855, and the one after closes at 1.0871. That close is above 1.0862, so structure broke.
Your order block is the red candle. Zone is 1.0831 to 1.0836. That is where you are looking to buy if price returns.
What disqualifies a candidate
- No structure break. If the move up stalled below the previous high, there is no order block. There is just a bounce.
- The move was slow. If it took nine candles of overlapping bodies to break the high, the candle you are marking is not meaningful. You want the break to come from displacement, meaning one or two candles that are clearly larger than the recent average and that close near their extremes.
- Price already came back through it twice. The zone is used up.
How to find a bearish order block
Exactly the same, flipped.
- Price closes below a previous swing low.
- Walk back to where the down move started.
- The last up candle before it is your bearish order block.
- Mark that candle's high and low.
On GBP/USD 5m: swing low at 1.2604. Price grinds up, prints a green candle from 1.2631 to 1.2638, then two candles later closes at 1.2598. Structure broke down. The order block is 1.2631 to 1.2638, and you are looking to sell if price gets back there.
The one thing that trips people up on the bearish side is that the up candle you are looking for is often the highest candle of the whole swing, so its high is also the swing high. That is fine and actually helps. It means your invalidation level is the same as the structural level, which keeps the trade clean.
Refined versus unrefined order blocks
An unrefined order block is the whole candle, wick to wick. A refined one is a narrower band inside it.
Why refine at all: candles with long wicks make wide zones. On GBP/JPY a single 5m candle can have a 25 pip range. Entering at the top of that zone and putting invalidation below the bottom gives you a bad entry and a wide stop at the same time.
The common refinements, from loosest to tightest:
- Full candle. High to low. Widest, hardest to miss, worst entry price.
- Body only. Open to close. This is the most used version and a sensible default.
- Wick to body. For a bullish block, the low of the wick up to the open. Useful when the candle has a long lower wick, because it targets the part of the candle price actually rejected from.
- Upper 50 percent of the body. Very tight. You will miss a lot of trades and get a good price on the ones you catch.
What I would actually do: mark the full candle as the invalidation boundary, and mark the body as the entry band. If price wicks into the full zone but never trades into the body, you missed it. That is fine. If price trades into the body and then wicks below it but holds the candle low, you are still in a valid trade.
The tighter you refine, the more setups you miss and the better your average entry on the ones you take. There is no correct answer, only a trade-off you should pick deliberately rather than by accident.
What makes one order block better than another
On a busy 5m chart you can find a dozen candidates. Most are noise. Here is what separates the ones worth waiting for.
It sits at the base of a displacement leg. The move away from it should be obvious at a glance. If you have to squint to see the impulse, skip it.
The move left a fair value gap. This is the easiest mechanical test for displacement. If the three candle sequence out of the zone left an untouched band, the move was fast. If it did not, it was drift.
It is unmitigated. Price has not been back into it since it formed.
It is in the right half of the range. A bullish order block at 70 percent of the dealing range is a bad buy even if every other box is ticked.
There is liquidity behind it. A bullish order block that sits just below a pool of equal lows is better than one sitting in open space, because price has a reason to come down that far.
It aligns with the higher timeframe. A 1m bullish order block inside a 15m downtrend is a countertrend trade. Sometimes those work. They are not the ones to learn on.
If a candidate has four or five of these, it is worth an alarm. If it has one, it is a candle.
Order blocks versus supply and demand zones
People argue about this and the argument is mostly about words.
A demand zone in classical supply and demand teaching is the base a rally started from. Usually that means a small group of candles: a few small bodies sitting sideways before the move, sometimes called a rally-base-rally or drop-base-rally depending on how price got there. You mark the whole base.
An order block narrows that to one candle, the last opposing one, and adds a requirement that the move afterwards broke structure.
Same idea, different precision. If you already trade supply and demand, you do not need to relearn anything. You are being stricter about two things: where the zone starts and stops, and whether the leg out of it actually did something structurally.
Which is better depends on the pair and your timeframe. Wide bases work better on slow instruments and higher timeframes where price rarely returns to an exact candle. Single candle order blocks work better on fast intraday charts where a wide zone means a wide invalidation you cannot afford.
One thing the classical version does better: it forces you to look at the base, meaning the consolidation before the move. A tight three candle base that then exploded is a stronger area than a single candle that happened to be red. Worth borrowing even if you mark order blocks.
What to watch when price arrives at the zone
Marking the zone is the easy half. The decision happens when price gets there, and it happens fast.
How price approached. Fast and impulsive into the zone is what you want. A vertical drop into a bullish order block usually means the move overextended and the zone gets a reaction. A slow stair-step down, where each candle closes near its low and the pullbacks get smaller, means sellers are in control and they will probably keep going.
The first candle inside the zone. If it trades into the zone and closes back out of it with a wick pointing into the zone, that is the reaction you were waiting for. If it closes inside the zone and sits there, the zone is under pressure. If it closes through, it is done.
Whether the wick is long. A long rejection wick into the zone, meaning the kind of shape covered in hammer and shooting star, is the cleanest single-candle confirmation you get. It says price reached those prices and could not stay.
What the lower timeframe is doing. On a 15m zone, drop to the 1m and look for a change of character. You want a 1m close above the last 1m lower high while price is inside the 15m zone. That converts a level into a trigger.
How long price stays. A zone that price bounces out of within one or two candles is working. A zone price sits inside for six candles is being consumed. Time spent in the zone is not neutral information.
None of this makes the trade certain. It changes it from "price is at my line" to "price is at my line and doing the specific thing I said would happen." Those are different trades.
A London open example
GBP/USD, and the London session because that is when the pair moves.
Through the Asia session GBP/USD grinds in a 22 pip range between 1.2604 and 1.2626. There are three lows within a pip of 1.2604. That is a shelf.
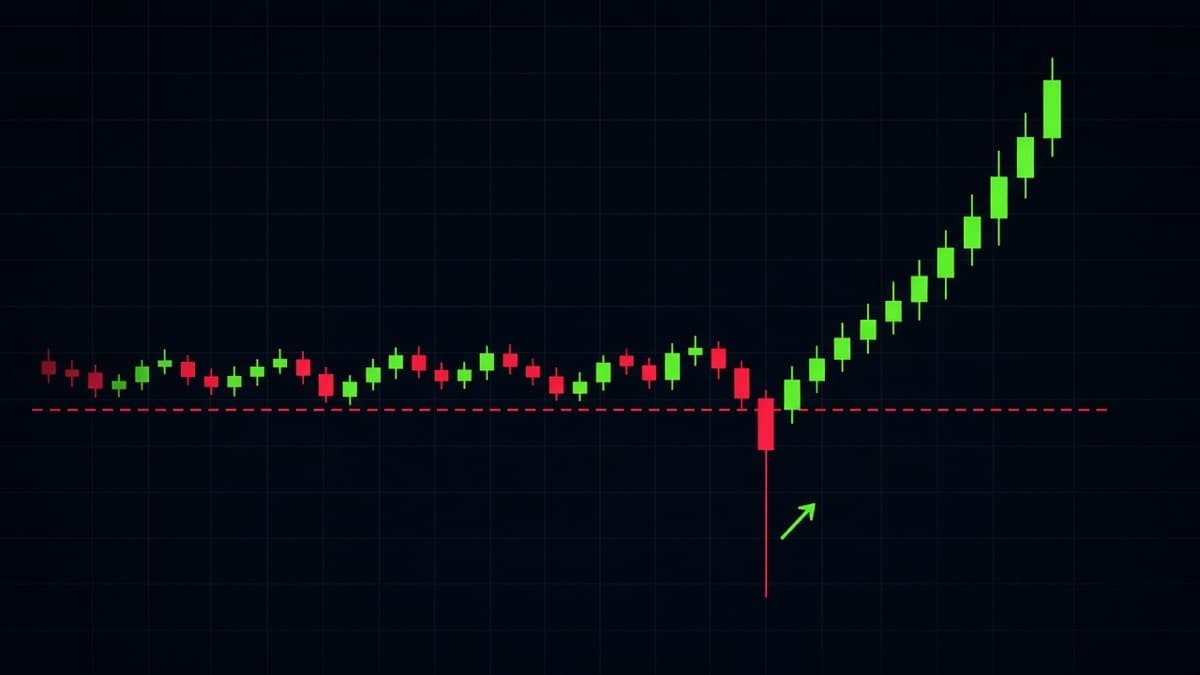
At the London open price drops, takes 1.2604 out with a wick to 1.2596, and closes the 5m candle back at 1.2609. That is the sweep. The next two 5m candles run to 1.2638, which closes above the Asia range high. Structure broke up.
Now walk the leg back. The last down candle before it started spans 1.2601 to 1.2607. That is your bullish order block, and notice that it sits inside the swept area, which is exactly where you want it.
The leg from 1.2609 to 1.2638 left a fair value gap between 1.2617 and 1.2622. So you have two levels: the gap at 1.2617 and the order block at 1.2607.
What happened next in this kind of sequence, more often than not, is a retracement into the gap during the next twenty minutes, then continuation. Sometimes it goes deeper and taps the order block. Sometimes it does neither and runs straight to the previous day's high.
The lesson is not that this always works. It is that every piece of the analysis was available before the entry, and the invalidation was known: below 1.2596, the sweep low. Session behaviour and which pairs move when is covered in forex pairs and trading sessions.
Order blocks and fair value gaps together
These two overlap constantly, and the overlap is where the better entries live.
Think about the sequence. Price sits in a zone, then displaces away from it. The displacement leg is what makes the zone an order block. That same displacement leg, if it is fast enough, leaves a three candle gap behind it. So the gap sits just above the zone on a bullish setup.
That gives you two levels at different distances:
- The gap is closer to current price. You get filled more often, at a worse price, with a wider invalidation.
- The order block is further away. You get filled less often, at a better price, with a tighter invalidation.
A workable approach on a 15m structure and 1m entry: take a partial position at the gap and leave the rest for the order block. If price only reaches the gap and runs, you are in. If it comes all the way back, you improved your average. Both outcomes are acceptable, which is the point.
More on how gaps behave on their own is in fair value gap explained.
Breaker blocks
A breaker block is an order block that failed, got broken through, and then works from the other side.
Here is the bullish version step by step.
- Price makes a low. Call it 1.0780.
- Price rallies to a high. On the way up, or at the top, there is a group of down candles. That is supply.
- Price falls back and takes out 1.0780 with a wick, sweeping the stops below.
- Instead of continuing down, price turns and rallies hard, closing above that supply zone at the earlier high.
- That broken supply zone is now a bullish breaker. When price pulls back into it, the expectation is support.
What makes breakers interesting is the completed liquidity event. The stops below the low have already been taken, which removes one reason for price to go back down there. The old resistance turned support logic that classical traders have used forever is the same mechanic, described in more detail in chart patterns.
The bearish breaker is the mirror. A high gets swept, price drops through the demand below it, and that broken demand zone becomes resistance.
One caution. Breakers only mean something if the break through the zone was decisive. A candle that closes two pips past the zone and then stalls has not broken anything. You want a close well beyond it, ideally with a gap left behind.
Mitigation blocks
A mitigation block is an order block taken from a swing point whose liquidity was never taken.
The bullish case: price makes a low at 1.0780, rallies, pulls back, and makes a higher low at 1.0798 without ever going near 1.0780. Then it rallies again and breaks structure to the upside. The last down candle at that 1.0798 higher low is the mitigation block.
The distinction from a regular order block is subtle and mostly about naming. The distinction from a breaker is real: a breaker has a sweep behind it, a mitigation block does not.
Practical read on this: mitigation blocks show up most often in strong trends where price does not bother coming back for the older lows. That makes them decent continuation levels in a trend and poor reversal levels anywhere else. If you are using one, you should be trading with the higher timeframe, not against it.
Do not spend too long on the taxonomy. Breaker, mitigation block, order block: all three are "a zone price left in a hurry, marked precisely." The context around them decides whether they work, not the label.
When the order block retest fails
This is the section most order block articles skip, which is odd, because failure is the common case.
Price returns to your bullish order block, trades into the body, and then closes below the candle low. That is a failed retest. You are out or you never got in.
What usually caused it:
The higher timeframe was against you. The single most common cause. Your 5m zone was fine; the 1h was in a downtrend and every 5m bounce was getting sold.
The zone was in premium. You bought at 70 percent of the range and the range had not finished retracing.
The move away from the zone was not displacement. You marked a candle at the base of a drift. There was never anything there.
News. An economic release makes every technical level irrelevant for several minutes. If the zone is going to be tested at the same time as a release, either take it off the table or accept that you are gambling on the number.
It was the second or third test. First return is the one with the cleanest reaction.
How to tell a failure from a deep wick, live
This is the hard part in real time. Some rules that help:
- Judge on closes, on the timeframe you marked the zone. A 1m close below a 15m order block means nothing. A 15m close below it means the zone failed.
- Watch how price arrives. Arriving fast with a big candle into the zone and then reversing is normal. Grinding into the zone with five small candles that keep closing lower is a failure in progress.
- If price closes through the zone and then comes back up to test it from below, that is now a bearish level, not a bullish one. It has inverted. Treat it as resistance.
That last point is worth taking seriously. A broken bullish order block is a bearish level. The same candle you were going to buy is now a place to consider selling. Being willing to flip is more useful than being right.
Which timeframe should you mark order blocks on?
Two timeframes, three to five steps apart. One for direction, one for the zone.
| Structure timeframe | Where you mark the zone | Typical zone width on EUR/USD |
|---|---|---|
| 4h | 1h | 25 to 50 pips |
| 1h | 15m | 10 to 20 pips |
| 15m | 5m | 6 to 12 pips |
| 15m | 1m | 2 to 5 pips |
The 15m structure with 1m zones is the practical default for short-term trading. It gives you a direction that lasts an hour or two and an entry tight enough that your invalidation is only a few pips away.
Below the 1m, zones stop being useful. On 15 second candles you are marking spread and tick noise, not areas where anything happened.
Order blocks on short binary expiries
Honest assessment: order blocks are the part of the framework that transfers worst to fixed expiries.
The reason is timing. An order block is a level you wait at. You do not know if price will arrive in two minutes or forty. A spot trader can leave a limit order and go make tea. On a 1 minute binary you have to be right about direction and arrival time in the same decision.
What you can do about it:
- Wait for the tap, then take the reaction. Do not buy the contract because price is approaching the zone. Wait until a candle has actually traded into it and closed, then take the next candle. You give up some of the move and you remove most of the timing problem.
- Use the zone as a filter, not a trigger. If price is sitting in a bullish order block, stop taking DOWN signals. That alone improves things.
- Match expiry to the timeframe you marked. A 1m order block reaction resolves in one to three candles. A 15m zone reaction takes ten to thirty minutes. Taking a 1 minute expiry off a 15m zone is a coin flip with extra steps. Binary options expiry times explained goes through the matching properly.
And size it like the uncertain thing it is. Whatever you conclude about the zone, the position sizing rules in risk management for binary trading decide whether you are still trading next month.
Trading one, start to finish
EUR/USD, 15m structure, 1m entry. This is the full sequence.
- Check the 15m. Higher highs and higher lows. Last higher low at 1.0811. Longs only.
- Find the range. 1.0811 to 1.0879. Midpoint 1.0845. You will only buy below that.
- Find the break. The 15m closed above 1.0862 earlier. That leg started from a red candle spanning 1.0831 to 1.0836.
- Mark the zone. Invalidation boundary 1.0831 to 1.0836. Entry band 1.0833 to 1.0836 (the body).
- Check quality. The leg left a fair value gap between 1.0841 and 1.0846. Displacement confirmed. Zone is unmitigated. Zone is in discount. Four boxes ticked.
- Wait. Set an alert at 1.0838. Do nothing until it fires.
- The alert fires. Drop to the 1m. You are looking for the first 1m candle that trades into 1.0836 and closes back above it.
- Enter. On the close of that candle, or on the 1m change of character right after it.
- Invalidate. Below 1.0831. If the 1m closes below the candle low, the read was wrong and you are done with this level.
- Targets. 1.0845 at equilibrium, then 1.0862, then the range high at 1.0879 where buy stops are resting.
Steps 1 to 5 take three minutes. Step 6 might take four hours. Most of the work in this style is waiting, and most of the losses come from not waiting.
Common mistakes
Marking a zone with no structure break behind it. The break is what makes the candle an order block. Without it you have drawn a box on a random red candle.
Using the highest timeframe candle you can find. A daily order block on a pair you are trading with 1 minute expiries is not a level, it is a region. Match the zone to the holding time.
Entering before price reaches the zone. "It is close enough" costs more than any other single habit. Either price trades into your band or it does not.
Moving the zone. If price goes through it and you redraw the zone five pips lower to stay in the trade, you have stopped analysing.
Ignoring what the wick tells you. A long lower wick on the order block candle usually means price already tested down there once. That lowers the odds of a clean reaction on the return.
Stacking six zones and calling it confluence. Six overlapping boxes is not confirmation, it is indecision drawn on a chart.
Forgetting the liquidity question. Before you take the long, look below your zone. If there is a clean shelf of equal lows 8 pips under it, expect price to go there first. That is covered in liquidity sweeps and stop hunts.
Where automated reading fits
For context on the REDBERRY side of this: the desk reads market structure from live data rather than asking you to mark candles by hand.
Live pairs use the TradingView API for realtime price and chart structure, and the inbuilt strategies work from that to predict the next move. OTC pairs use private Quotex API access for a live OTC price feed, with the same inbuilt strategies on top.
Signals are not 100 percent accurate. Nothing that forecasts the next candle is. Knowing how to mark a zone yourself still matters, because it tells you when a signal lines up with the level you already had and when it is fighting one. REDBERRY is a non-profit informational desk and not a broker, so the trade is always your call. The mechanics are in how REDBERRY generates Live and OTC signals.
A three week exercise
Take one pair. EUR/USD is the easiest because it behaves.
Every day, mark the last five 15m order blocks. For each one write down: was there a structure break, did the leg leave a gap, was the zone in premium or discount, and did price return to it within the session. Then write what happened on the return.
After fifteen sessions you will have seventy-five marked zones and a very clear picture of which of the quality filters above actually matter on your pair, at your hours. That is worth more than any list somebody else wrote, including this one.
Questions people ask
What is an order block in trading?
It is the last opposing candle before a move that breaks market structure. For a bullish order block, that means the last down candle before a rally that took out a swing high. You mark that candle's high and low as a zone and watch what price does when it returns.
Should I use the wick or the body of the order block candle?
Use the full candle including the wick as your invalidation, and the body as your preferred entry band. That way a deep wick into the zone does not take you out of a trade that was still structurally fine, but you are not entering at the very top of a wide zone either.
What is the difference between a breaker block and a mitigation block?
A breaker forms at a swing point whose liquidity was taken before price reversed, and the zone gets broken through before it works from the other side. A mitigation block forms at a swing point that was never swept. The breaker has a completed liquidity event behind it, which is why many traders rate it higher.
How many times can an order block be retested?
The first return is the one with the cleanest reaction. After that, expect less. If price has already tapped a zone twice and is grinding into it a third time with smaller bounces each time, treat the zone as failing rather than as a discount entry.
Do order blocks work on OTC pairs?
The zones still form and price still reacts to them, because the structure on the feed behaves like price structure. What does not carry over is the story about institutional orders resting in the zone, since OTC pairs are synthetic instruments rather than the interbank market. Read the zone, skip the narrative.
Nothing here is financial advice. Signals and setups can be wrong, so only risk money whose loss will not change your life.