Fair Value Gap Explained: How to Mark and Trade FVGs
Fair value gap explained with the three candle rule: how to mark an FVG, the 50 percent line, inversion gaps, 1m versus 15m behaviour, and unfilled gaps.
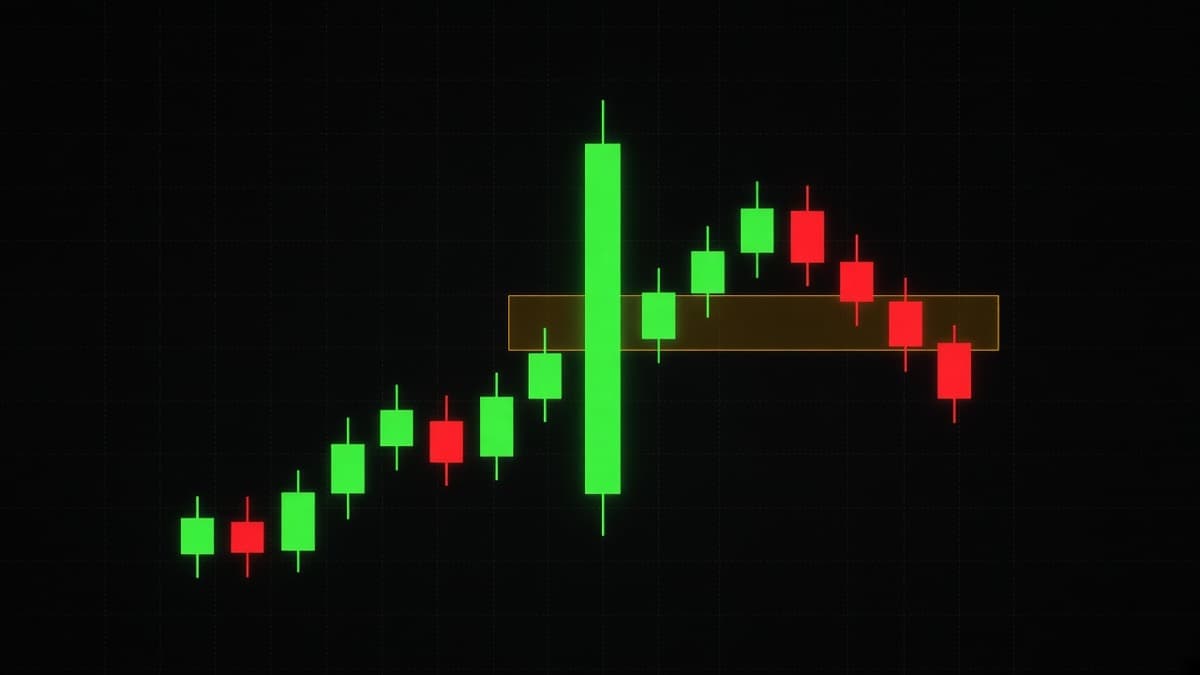
A fair value gap is the band between the first and third candle of a three candle move, when those two candles do not overlap. That is the whole rule. If the high of candle one sits below the low of candle three, you have a bullish gap. If the low of candle one sits above the high of candle three, you have a bearish one.
Everything else is about which gaps matter, how deep the fill usually goes, and what to do when price closes straight through.
What is a fair value gap?
Price normally trades back and forth. Buyers and sellers both get filled at each price on the way through, and the candles overlap because of it. When something pushes price hard in one direction, that two-sided trading stops happening. Price jumps through a band with almost all of the volume on one side.
That band is the fair value gap. The name is a bit grand for what it is: a visual marker of where price moved too fast to trade properly.
Why traders care: the argument is that unfinished business at those prices pulls price back. Whether that is really what happens is not something you can prove from a chart. What you can observe is that price often does return to these bands, and that the return frequently stops right inside them rather than going straight through. That is enough to make the band useful as a level.
You will also see it called an imbalance, or sometimes a BISI (buy-side imbalance, sell-side inefficiency) for bullish gaps and SIBI for bearish ones. Same thing. The framework the term belongs to is covered in smart money concepts.
The three candle rule
Take any three consecutive candles and check one comparison.
Bullish fair value gap: high of candle 1 < low of candle 3. The gap runs from that high to that low.
Bearish fair value gap: low of candle 1 > high of candle 3. The gap runs from that high to that low.
Concrete example on EUR/USD 5m:
- Candle 1: high 1.0832
- Candle 2: runs from 1.0830 up to 1.0858
- Candle 3: low 1.0841, high 1.0862
1.0832 is below 1.0841, so there is a bullish gap between 1.0832 and 1.0841. Nine pips wide.
The middle candle is the one that did the work, but its own high and low are not what you measure. This trips people up constantly. You measure candle 1 and candle 3 only.
How to mark one correctly
Three rules that keep your chart honest.
Use wicks, not bodies. The gap is defined by the extreme of candle 1 and the extreme of candle 3. Some traders mark body to body to get a tighter zone. That is a refinement, not the definition, and you should know which one you are drawing.
Mark it on one timeframe. A 1m gap and a 15m gap in the same area are two different levels with two different expected hold times. Do not blend them.
Do not extend it forever. A gap from four days ago on the 1m chart is not a level. Give a gap a shelf life proportional to the timeframe it formed on. On the 1m, if it has not been touched in a couple of hours, delete it. On the 4h, it can sit for a week.
One extra filter that matters more than any of these: did the move that created the gap break structure? A gap inside a range is decoration. A gap left by the leg that took out a swing high is a level.
Consequent encroachment: the 50 percent line
Draw a line through the middle of the gap. That midpoint has a name in ICT terminology, consequent encroachment, and the shorter name is just "the 50 percent."
Why it is worth marking: a lot of returns stop around halfway rather than going all the way through. If your entry plan requires a full fill, you will watch a good number of setups turn without you.
Using the EUR/USD example above, the gap runs 1.0832 to 1.0841, so the midpoint is 1.08365. Three ways to play it:
- Enter at the top of the gap (1.0841). Best fill rate, worst price, widest invalidation.
- Enter at the midpoint (1.08365). The compromise most people settle on.
- Enter at the bottom (1.0832). Best price, and you will miss maybe half the setups.
There is no correct answer. Pick one and be consistent, because switching between them based on how you feel about a particular trade is how you end up with the worst version of all three.
A note on where your invalidation goes. If you enter at the midpoint, the bottom of the gap is not far enough away for invalidation. Price can trade to the bottom of the gap and still work. Put invalidation below the low of candle 1, or below the swing low that the whole move came from.
Inversion fair value gaps
A gap that fails becomes a level on the other side.
Price leaves a bullish gap between 1.0832 and 1.0841. Instead of holding there, price comes back and closes a candle below 1.0832. The gap did not work as support. Now, when price rallies back to that band, the expectation flips: it is a place to look for selling.
This is the same idea as broken support becoming resistance, and there is nothing exotic about it. What makes it worth naming is that it gives you something to do with a failed level instead of just deleting it.
Two conditions before you treat a gap as inverted:
- Price must close through it on the timeframe you marked it. A wick through and back does not invert anything. A wick through is a sweep, and that is a different event entirely, covered in liquidity sweeps and stop hunts.
- The move through it should be decisive. A candle that closes half a pip past the bottom of the gap and stalls has not made a statement.
Inversion gaps tend to work best right after the break, while the move is still fresh. A gap that inverted three hours ago on the 1m has usually stopped mattering.
How gaps behave on 1m versus 15m
This is the practical difference most articles skip, and it changes everything about how you use them.
| 1m gap | 15m gap | |
|---|---|---|
| Typical width on EUR/USD | 1 to 4 pips | 6 to 15 pips |
| How often price returns | Most of them, usually within the hour | Often, but it can take a session |
| Reaction size | A few pips | 15 to 40 pips |
| Useful for | Timing an entry you already decided on | Deciding where the entry is |
| Shelf life | Minutes to an hour | Hours to a day |
The way to read that table: 1m gaps are triggers, 15m gaps are levels.
A 1m gap on its own is close to meaningless. There are dozens of them on any given hour and price fills them constantly in both directions. What a 1m gap is good for is timing. You have already decided from the 15m that you want to be long around 1.0836. Price sweeps a low, displaces up, leaves a 1m gap at 1.0838, and that gap is your entry trigger inside the level you already chose.
A 15m gap is the opposite. There might be two or three worth watching in a session. They are wide enough to enter inside and they produce reactions large enough to be worth trading.
Gaps inside gaps
On a strong leg you will often find a 15m gap that contains three or four 1m gaps. This is normal and it is useful.
Use the 15m gap to decide the area. Use the highest 1m gap inside it, meaning the one price reaches first, as your entry if you want a shallow fill. Use the lowest one if you want a better price and are prepared to miss it.
What not to do is treat the presence of four nested gaps as four separate signals. It is one move, viewed at two zoom levels.
When price never comes back
Plan for this, because it happens often enough to matter.
The gaps that most often stay open:
- Gaps left by the first leg of a new trend, right after a change of character. Price is repricing, not retracing.
- Gaps left during a news release. The market found a new level and has no reason to revisit the old one.
- Gaps well inside a strong trend on a lower timeframe, where the higher timeframe pullback never reaches that deep.
The practical consequence: never sit and wait for a specific gap to fill as your only plan. If your entry is a limit order at a gap and price runs away without you, that is a missed trade and nothing more. The failure mode is when people talk themselves into chasing, or worse, into shorting a strong uptrend because "there is an unfilled gap below."
An unfilled gap below is not a short signal. It is a place price might go eventually.
Which gaps to ignore
Most of them. Some filters:
Gaps smaller than the spread. On EUR/USD a 0.4 pip gap on the 1m is not tradeable. On OTC pairs with wider effective costs, the threshold is higher.
Gaps in a range. If price has been rotating between 1.0820 and 1.0840 for two hours, the gaps inside that rotation mean nothing. They form and fill constantly.
Gaps that formed against the higher timeframe. A bearish 1m gap inside a clean 15m uptrend is a level you should expect to fail.
Gaps already tested. First return is the one that counts. A gap that has been traded through twice is used up.
Gaps from a news spike. The candle that runs 40 pips on an interest rate decision leaves a huge gap. That gap is not a level, it is a measurement of how surprised the market was.
Pairing a gap with an order block
The two levels come from the same move, and they sit at different distances.
The order block is the last opposing candle before the leg started. The gap is inside the leg. On a bullish setup, the gap is above the order block.
So you have a shallow entry (the gap, filled more often, worse price) and a deep entry (the order block, filled less often, better price). Splitting between the two is a reasonable way to handle not knowing how deep the pullback will go. The zone side of that is covered in order blocks explained.
The full sequence: sweep, displacement, gap
The highest quality version of a gap trade has three parts in order.
- Sweep. Price takes out an obvious low with a wick and closes back above it. Now you know where you are wrong.
- Displacement. A fast candle or two in the opposite direction, closing beyond the most recent minor high. This is what tells you the sweep meant something.
- Gap. That displacement leg leaves a fair value gap. That is your entry.
Concrete: GBP/USD 1m. Three lows at 1.2604. A candle wicks to 1.2596 and closes at 1.2609. The next two candles run to 1.2621, taking out the small high at 1.2614. Those three candles leave a gap between 1.2609 and 1.2613. You enter at 1.2613 or at the midpoint of 1.2611, and you are wrong below 1.2596.
That last number is what makes this workable. Without the sweep, you would be guessing where the invalidation goes.
A worked bearish example on USD/JPY
USD/JPY 5m during the New York session, because the pair gets its cleanest legs there.
The 1h has been making lower highs since the London close. The last lower high is 151.62. Price rallies through the afternoon and reaches 151.58, so you are near the top of the range and the higher timeframe is against further upside. That is the context. Without it the rest is guessing.
There are two 5m highs at 151.57 and 151.58, a pip apart. Call them equal highs. At 15:40 UTC a candle runs to 151.66, clearly through both, and closes back at 151.54. Sweep.
The next two 5m candles drop: one from 151.54 to 151.31, the next from 151.31 to 151.18. Check the three candle rule using the sweep candle as candle 1.
- Candle 1 low: 151.52
- Candle 3 high: 151.33
151.52 is above 151.33, so there is a bearish gap between 151.33 and 151.52. That is 19 pips wide, which is large for a 5m gap on USD/JPY and tells you the move was fast.
Midpoint is 151.425. Three entry choices, same as always: the bottom of the gap at 151.33 (shallow, likely to fill), the midpoint at 151.425, or the top at 151.52 (best price, might not get there).
Invalidation is above 151.66, the sweep high. Not above the gap. The gap is your entry area, the sweep high is your proof you were wrong.
What you would not do: sell at 151.58 before the sweep happened, because the equal highs above you were the obvious thing price was going to reach for first.
How to grade a gap before you trade it
Run through this quickly before committing. Each yes is a point.
- Did the leg that created it close beyond a swing high or low? (structure)
- Is the gap wider than three times the spread on that pair?
- Is it untouched?
- Is it on the correct side of the range midpoint for your direction?
- Did a liquidity sweep happen just before the leg?
- Does the higher timeframe agree with the direction?
- Is there an order block sitting just beyond it as a backup level?
Five or more and it is worth an alert. Two or three and you are trading a box you drew on a chart.
The point of a list like this is not the score. It is that it stops you from taking the gap you noticed because it was on screen, which is how most marginal trades happen.
What a partial fill tells you
Price comes back to your bullish gap, trades into the top third, and turns. It did not fill the gap. Was that a valid entry?
It depends what you were watching for. Some reads on partial fills:
Turns at the top edge without entering. Strong. Buyers were not willing to wait for a better price. It also means you probably did not get filled if you had a limit order in the middle.
Turns at the midpoint. The most common outcome and the reason the 50 percent line is worth marking.
Fills completely, then turns from the bottom edge. Also fine, and it gives you the best price, but be careful: a full fill followed by a candle closing below the gap is the start of an inversion, not a bounce.
Sits inside the gap for six candles. Not a fill and not a rejection. Price is deciding. This is the case where the gap stops being useful, because whatever imbalance was there has been traded through slowly. Stand down.
The general principle: fast in and fast out of a gap is a reaction. Slow grinding through a gap is consumption. You want the first one.
Related terms you will run into
Volume imbalance. A smaller version of the same idea, where candle bodies do not overlap but the wicks do. The band between the close of one candle and the open of the next. Weaker than a full gap, worth noting on the 1m only.
Opening gap. The difference between Friday's close and Monday's open in forex. That is a real price gap, not a fair value gap, and it usually fills early in the Asia session.
Liquidity void. Often used loosely to mean a large fair value gap, sometimes several stacked together, covering a big range that price crossed in one or two candles.
Balanced price range. An area where a bullish and a bearish gap overlap at the same prices, meaning price crossed the band fast in both directions. Treated as a neutral zone rather than a directional level.
You do not need to use any of these words. You do need to recognise them, because they come up constantly in discussion and they mostly describe the same thing at different sizes.
Fair value gaps and short binary expiries
Gaps are the part of the framework that transfers best to fixed expiries, and it is worth understanding why.
The reason is speed. A 1m gap fill and the reaction out of it typically resolves inside two to four candles. That fits a 1 to 5 minute expiry. An order block retest, by contrast, might happen in ninety seconds or in forty minutes, and a fixed expiry cannot wait.
What to be careful about:
- The reaction is small. A 2 pip 1m gap might produce a 5 pip bounce. On a binary that is enough, because you only need direction. On spot it would not be worth the spread. Do not confuse the two.
- Direction is not enough on its own. You have to be right about direction inside a fixed window. If price takes five candles to react to a gap you entered with a 1 minute expiry, you lose on a correct read. Match the expiry to the timeframe of the gap, as set out in binary options expiry times explained.
- OTC feeds behave differently. OTC pairs on Quotex are synthetic instruments. Gaps do form on those feeds and price does react to them, but the explanation about institutional order flow does not apply the same way. Use the shape, not the story.
Whatever you decide about a gap, the stake size decision is separate and matters more. Risk management for binary trading covers that side.
Fair value gap versus a normal price gap
Worth clearing up, because the words are similar and the things are not.
A price gap is when a market closes at one price and opens at another, with no trading in between. Weekend gaps in forex, overnight gaps in stocks. There is literally no price data in the gap.
A fair value gap happens inside continuous trading. Price did trade at every price in the band, just very quickly and mostly in one direction. The "gap" is in the overlap between candles, not in the data.
The two behave differently and the classical rules about gap fills do not transfer. Keep them separate in your head.
Common mistakes
Measuring the middle candle. The gap is defined by candle 1 and candle 3. The middle candle's high and low are not part of it.
Marking every gap on the chart. On a 1m chart you can find thirty in an hour. Mark the ones inside a leg that broke structure and delete the rest.
Treating an unfilled gap as a target. A gap below price is not a reason to short. It is a place price might trade to at some point.
Entering at the far edge with no plan for the near edge. If you put a limit at the bottom of the gap, decide in advance what you do if price only reaches the midpoint and leaves. Usually the answer is nothing, and that is fine.
Ignoring the close. A wick through the gap is not a fill. A close through it is. The difference decides whether the level inverted or held, and it is the same distinction that matters for candlestick patterns generally.
Using 1m gaps as standalone signals. They are timing tools inside a level you chose for other reasons. On their own they are noise with a box drawn around it.
How automated reading handles this
For the REDBERRY side: the desk reads chart structure from live data rather than asking you to mark gaps by hand.
Live pairs use the TradingView API for realtime price and chart structure, and inbuilt strategies work from that to predict the next move. OTC pairs use private Quotex API access for a live OTC price feed, with the same inbuilt strategies applied.
Signals are not 100 percent accurate, and nothing that forecasts the next candle can be. Knowing how to spot an imbalance yourself is still worth the effort, because it tells you when a signal agrees with the structure you can see and when it is pointing into an area price just left in a hurry. REDBERRY is a non-profit informational desk, not a broker. How the two feeds work is in how REDBERRY generates Live and OTC signals.
Practice this for two weeks
One pair, one timeframe pair, fifteen minutes a day.
Open EUR/USD 15m. Find every fair value gap from the last two sessions. For each one write down the width in pips, whether the leg that made it broke structure, and whether price returned within the same session. Then note how deep the return went: to the top edge, to the midpoint, to the bottom edge, or straight through.
After two weeks you will have real numbers for your pair at your hours. You will probably find that most returns stop somewhere between the top edge and the midpoint, and that the gaps which never fill are almost all from legs that started a new trend. That is more useful than any general rule, because it is yours.
Questions people ask
What is a fair value gap in trading?
It is the price band left behind when three consecutive candles do not overlap. For a bullish gap, the high of candle one sits below the low of candle three, so the prices in between were skipped by a fast move. Traders mark that band and watch whether price comes back to trade through it.
How do you mark a fair value gap?
Take the three candle sequence. For a bullish gap, draw a box from the high of the first candle to the low of the third. For a bearish gap, draw from the low of the first candle to the high of the third. The middle candle's wicks are not part of the measurement.
Do all fair value gaps get filled?
No. Plenty never get touched again, especially gaps left by a move that started a strong new trend. Most gaps on the one minute chart fill within the hour because price moves back and forth a lot at that scale, but there is no rule that a gap has to fill, and building a strategy on the assumption that it will is how people end up holding losers.
What is an inversion fair value gap?
A gap that price closed through instead of respecting. A bullish gap that price closes below stops being a support band and often behaves as resistance when price rallies back to it. The name just marks the fact that the band flipped sides.
What is consequent encroachment?
It is the name for the 50 percent line of the gap, the midpoint between the top and bottom of the band. Some traders treat a tap of the midpoint as a complete enough fill to enter, rather than waiting for the whole gap to be traded through.
Are fair value gaps useful on one minute expiries?
They are one of the better parts of the framework for short expiries because gaps on the 1m chart fill quickly and the reaction usually comes within two or three candles. The problem is the fills are small, so you need the gap to sit at a level that matters rather than in the middle of a range.
Nothing here is financial advice. Signals and setups can be wrong, so only risk money whose loss will not change your life.