Morning Star and Evening Star Patterns Explained
Morning star and evening star patterns explained: the three candle sequence, the midpoint rule, gaps on 24 hour markets, and behaviour on short expiries.
A morning star is three candles that say the same thing in order: sellers were in control, then they stopped, then buyers took back more than half of what was lost. The middle candle is the whole point. Without a period that produced nothing, you have a bounce, not a reversal sequence.
The rule that decides whether you have the pattern is the midpoint test on the third candle, and it is the rule most traders skip. This article covers the sequence candle by candle, the midpoint rule with a diagram, what to do about the gaps that old descriptions require and 24 hour markets do not produce, and how the pattern behaves when you are trading short expiries.
The three candle sequence
Read it as three statements rather than one shape.
Candle one: the move that is ending
A long red body, in the direction of the existing trend. It needs real size relative to the candles around it, because the pattern is about that move being reversed, and reversing a small candle is not an event.
What you should see on the chart before it: an actual decline. Three or four candles of lower closes at minimum. A morning star with no downtrend in front of it is three candles in a range.
Candle two: the star
A small bodied candle that sits below the first one. It can be a small green body, a small red body or a doji. Colour does not matter here.
What matters is that it is small and that it did not continue the move. Sellers had momentum, and this period produced nothing with it. If the second candle is a wide red body making a new low, there is no pause, and there is no pattern.
The star's low is the most important price in the whole sequence. That is the price the pattern says was defended, and it is where the idea dies if price closes back below it.
Candle three: the takeover
A long green body that closes above the midpoint of candle one's body. It should close in the upper part of its own range, because a close in the middle means sellers were already pushing back inside the same period.
Candle three is the confirmation and the trigger. Until it closes, you have a long red candle and a small candle, which is not a signal.
The midpoint rule
The rule: candle three must close above the midpoint of candle one's body, not the midpoint of its full range.
If candle one opened at 1.0880 and closed at 1.0840, the midpoint is 1.0860. Candle three needs to close above 1.0860. Its wicks are irrelevant.
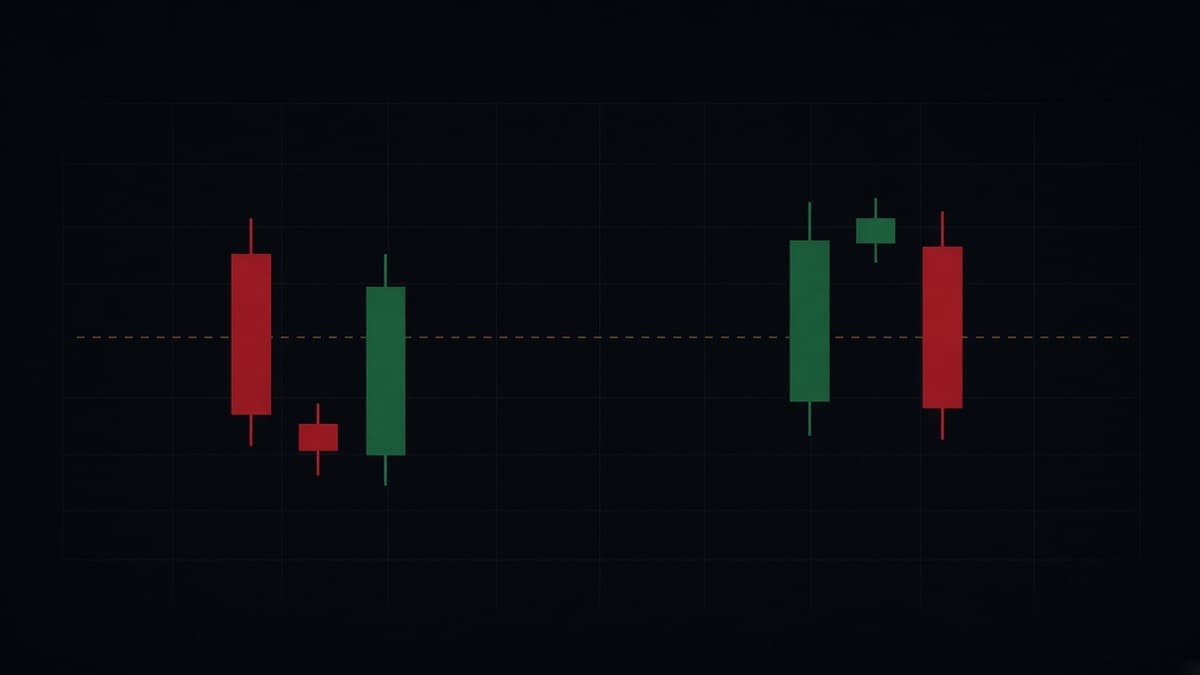
In the diagram, the first red body runs from 66.6 down to 59, so the midpoint sits at 62.8. The third candle closes at 65, well clear. The lower dashed line at 61 shows where a close would have failed: technically higher than the star, technically green, and not a morning star.
Why the rule exists
Because it is a measure of how much got undone.
Candle one represents a period of selling. If candle three only recovers a third of it, then two thirds of that selling is still intact, and the people who sold during candle one are still ahead. If candle three recovers more than half, most of them are not, and the ones who are will be defending or exiting.
The midpoint is not a magic number. It is a threshold that separates "buyers showed up" from "buyers took the period back". Some traders use the full close of candle one instead, which is stricter and produces fewer but cleaner setups. That variation is fine. What is not fine is having no threshold and calling every three candle bounce a morning star.
Evening star: the same thing at a top
Mirror the whole structure.
- A long green body in an existing uptrend.
- A small bodied star above it, any colour, that failed to continue the move.
- A long red body closing below the midpoint of candle one's body.
Invalidation is the high of the star. Everything else reads identically.
One pattern specific note. Evening stars tend to appear around session ends and around the times when the participants who drove a move stop participating. That is not a property of the pattern, it is a property of when trends run out of buyers, and it is worth knowing which hour you are in. Forex pairs and trading sessions covers the timings.
Gaps versus no gaps on 24 hour markets
Older descriptions of the morning star require gaps. Candle two gaps down away from candle one, then candle three gaps back up away from candle two. That produces the "island" look where the star sits isolated below everything.
Forex does not work that way, and neither do OTC pairs. Price runs continuously through the week, so each candle opens at, or within a tick of, the previous close. Gaps appear across the weekend break and occasionally around major news, and that is about it.
If you insist on gaps, you will find almost no morning stars on a forex chart. The pattern still exists there, so the requirement needs to be translated rather than dropped.
What the gap was supposed to prove
Two things. First, that the selling continued into the next period, since the gap down meant price opened lower than the previous close. Second, that the star was isolated, which made the pause visually obvious.
What to require instead
- The star's body should sit clear of candle one's body. For a morning star, the star's body should be at or below candle one's close, not sitting up inside the middle of it. Body separation replaces the gap.
- The star's range should be small relative to candle one. A pause means a contraction in range, which is measurable without any gap.
- Candle three must clear the midpoint. This condition was always the real test, and it does not depend on gaps at all.
Applied that way, the pattern is perfectly usable on EUR/USD 15 minutes or on an OTC chart. Applied with a literal gap requirement, it is a pattern for markets with an opening bell.
On OTC pairs specifically
OTC pairs are continuous in the same way, so the same translation applies. There is one extra thing to watch. Because OTC feeds run their own pricing, the size of a normal body on an OTC chart is not the same as on the Live chart for that currency pair, and the star pattern depends entirely on relative body sizes.
Calibrate before you trade it. Watch one OTC pair on one timeframe and note what a large body looks like and what a small one looks like on that chart. Then the phrase "the star should be small relative to candle one" becomes something you can actually apply. The platform differences are set out in Quotex trading guide.
The abandoned baby version
When the gaps do appear on both sides of the star, so the star is completely isolated with no overlap at all, the pattern is often called an abandoned baby. On forex and OTC charts you will rarely see it, and you should not go looking for it. Treat it as a rare and stronger form of the same sequence rather than something to wait for.
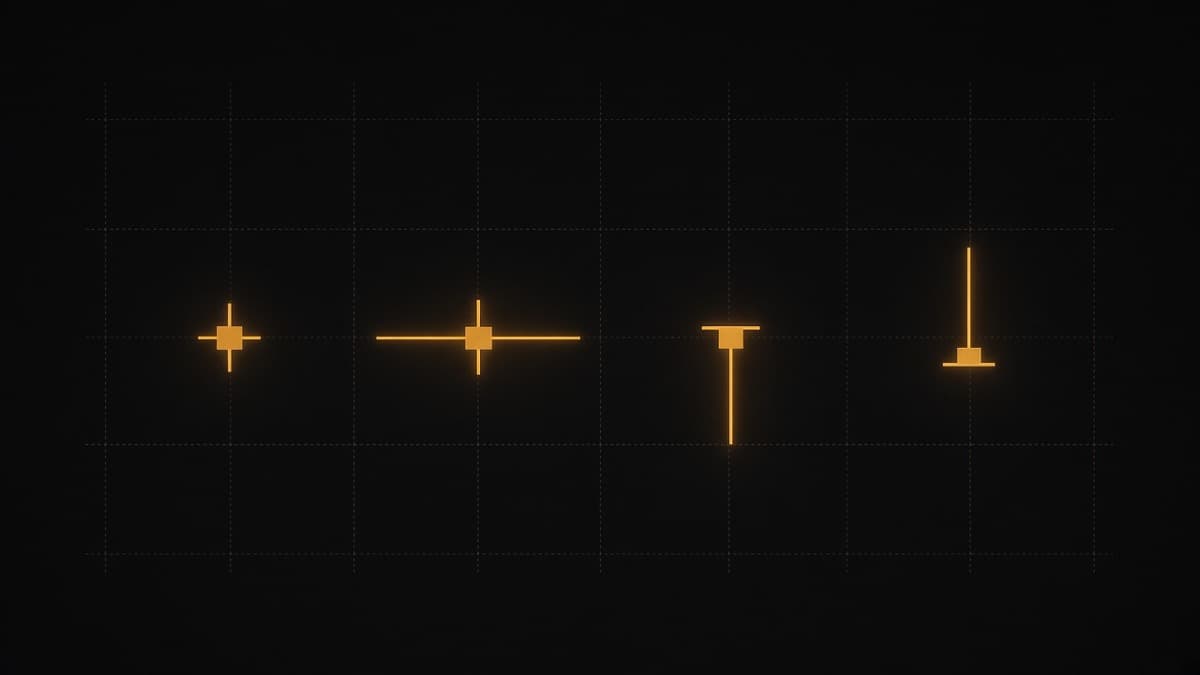
Morning doji star
When the star is a doji, the pause is complete. The period opened and closed at the same price, having made no progress in either direction.
That is marginally stronger than a small bodied star, because there is not even a partial continuation of the previous move. Everything else is unchanged: the midpoint rule still applies to candle three, the invalidation is still the doji low, and location still decides whether the sequence is worth trading. The doji family in general is covered in doji candlestick patterns.
Where the sequence actually works
The pattern is the trigger. The level is the reason.
A morning star whose star low sits at a price that has already held twice is a sequence with something behind it. The same three candles printed 40 pips above that price are three candles.
Run the same checks you would run on any reversal pattern:
- Is the star low at a level? A prior swing low, the bottom of a range, a flipped level, the origin of the last impulse.
- Was an obvious low swept just before? A wick through a known low, followed by the star holding above it, is the strongest version of this setup. The mechanics are in liquidity sweeps and stop hunts.
- What is the higher timeframe doing? A morning star at a pullback low inside a 1 hour uptrend is a continuation entry. The same sequence inside a 1 hour downtrend is counter-trend and needs smaller size.
- Did candle three close past something visible? Past the last two or three candle highs is meaningful. Inside them is not.
A point in this pattern's favour: three candles take time, which means the sequence cannot form during a single spike. That built-in delay filters out some of the noise that catches single candle traders.
A worked example
GBP/JPY on 15 minutes. The pair sells off through the New York session and reaches 189.10, which is the low of a range that held twice the previous day.
Candle one opens at 189.62 and closes at 189.18, a 44 pip red body with only small wicks. Real size, real selling. The midpoint of that body is 189.40.
Candle two opens at 189.18, trades down to 189.06, up to 189.29, and closes at 189.15. Body 3 pips. The low of 189.06 is 4 pips through the old range low, and price came back. That is the star, and it swept a known price on the way.
Candle three opens at 189.15 and closes at 189.54, with a high of 189.58. That close is above 189.40, so the midpoint test passes, and the close sits near the top of its own range.
The sequence is complete. Invalidation is 189.06, the star low. Entry at the close of candle three means 48 pips of risk, which is what decides the size.
Now the version that fails the test. If candle three had closed at 189.35, everything else identical, you would have a green candle that recovered less than half of candle one. Buyers showed up, they did not take the period back, and the correct action is to wait. Traders who call that a morning star because it looks like one on a small screen are taking a different trade from the one the pattern describes.
When a star pattern fails
Every rule is satisfied in that diagram. A long green candle, a small star above it, a long red candle closing below the midpoint. Then price goes straight back up through the entire pattern and makes a new high.
Why it failed: nothing was broken. The uptrend was still making higher highs and higher lows, no resistance level sat above, and the red candle did not take out any structural low. Three candles of profit taking inside a trend look exactly like an evening star, because that is partly what an evening star is. The difference between the two is whether there is a level and whether the trend structure is in question.
The failure signature is worth memorising: the pattern completes, price does not follow through within a candle or two, and then a body closes back above the star high. That last close is the exit, not a reason to wait.
Two other common failure conditions.
The star is too large. If the middle candle has a body nearly as big as candle one, there was no pause. Two large opposing candles with a medium one between them is just volatility.
Candle three is mostly wick. A third candle that clears the midpoint intraperiod but closes back in the middle of its own range has not confirmed anything. Judge the close.
Star pattern or engulfing candle?
They often describe the same event at different timeframes, and noticing that is genuinely useful.
Take a morning star on a 5 minute chart. Three candles: selling, pause, recovery. Now look at the same 15 minutes on a 15 minute chart. Those three 5 minute candles compress into one candle, and that candle has a long lower wick with the body near the top. A hammer.
The reverse happens too. A bullish engulfing candle on 15 minutes frequently breaks down into a small pause and a strong push on 5 minutes, which is a morning star without the first candle being obvious.
Two consequences follow.
First, stop treating the patterns as separate discoveries. You are looking at one piece of price behaviour, and the timeframe decides which name it gets. That is why chasing a longer list of pattern names adds so little.
Second, use the relationship deliberately. If you find a morning star on 5 minutes, check the 15 minute candle. If it is forming into a hammer at a level, you have the same read confirmed at two scales rather than one signal. If the 15 minute candle is a wide red body with no lower wick, your 5 minute sequence is happening inside a period that is still being sold, and the read is weaker than it looked.
The engulfing rules and the hammer ratios are in bullish and bearish engulfing candles and hammer and shooting star candles.
How the sequence behaves on short binary timeframes
Three candle patterns are harder to use on short expiries than two candle patterns, for one simple reason: by the time the pattern is complete, three periods have passed and part of the move has already happened.
That has practical consequences.
The pattern completes late. On a 5 minute chart, the morning star is confirmed at the close of candle three, which is 15 minutes after candle one opened. If you are trading 1 minute expiries, the question is whether the read still has room, and often it does, because the confirmation candle usually starts a sequence rather than ending one.
Entry is at the close of candle three, or on a pullback. Entering on the close of candle three means entering at the top of that candle's range, which is the worst price in the sequence. A pullback into candle three's body is better when it comes. On very short expiries you rarely get the choice.
Match the expiry to the candle size. A morning star on 5 minute candles is describing the next few 5 minute candles. A 15 second expiry taken from it is a different bet with a different probability. Binary options expiry times explained works through the matching, and risk management for binary trading covers what to do about the size.
Do not pre-empt candle three. Watching a candle form and entering because it looks like it will clear the midpoint is guessing where a close will land. It sometimes works and it ruins your ability to review your own results, because you cannot tell which trades followed your rules.
The three candle cousins
Two more three candle sequences are worth knowing, because they look similar at a glance and mean the opposite thing.
Three white soldiers is three long green bodies in a row, each opening inside the previous body and closing near its own high. There is no star and no pause. This is an initiation or continuation sequence, and coming out of a tight base it is real evidence that a new direction has started.
Three black crows is the same in reverse.
The difference from a star pattern matters. A star sequence says a trend stopped and turned. A soldiers or crows sequence says a direction has taken hold and is running. Confusing them means fading a move that is just beginning.
The trap in both is the entry price. By the third candle, price has already travelled a long way, and taking that close puts you in at the worst price of the run. Either act on the second candle with a defined invalidation, or wait for a pullback into the first candle's range.
Entry and invalidation summary
| Pattern | Confirmation | Invalidation | Entry options |
|---|---|---|---|
| Morning star | Candle three closes above candle one's body midpoint | Close below the star low | Close of candle three, break of candle three high, or pullback into candle three body |
| Evening star | Candle three closes below candle one's body midpoint | Close above the star high | Close of candle three, break of candle three low, or pullback into candle three body |
| Morning doji star | Same as morning star | Close below the doji low | Same as morning star |
| Three white soldiers | Third close near its high | Close below the first candle low | Second candle, or pullback into the first candle range |
| Three black crows | Third close near its low | Close above the first candle high | Second candle, or pullback into the first candle range |
How REDBERRY reads multi-candle structure
REDBERRY is a non-profit informational signal desk for Quotex. It is not a broker, it does not hold funds, and it does not place trades for anyone.
Live pairs use the TradingView API for realtime price and chart structure, so the algorithm can read the market as it prints, then inbuilt strategies work out the next likely move. OTC pairs use private Quotex API access for a live OTC price feed, with the same inbuilt strategies. Sequences across several candles are part of what any price based method reads, because the relationship between consecutive bodies is where momentum and exhaustion show up.
Signals are not 100% accurate, and nothing has a guaranteed read on the next candle. Learning the star sequence by hand is worth doing anyway, because it tells you what condition the chart is in. A signal that arrives while price is completing a morning star at a level you marked is a different situation from the same signal arriving mid-range, and that difference belongs in your position size. How REDBERRY generates Live and OTC signals describes the process.
For the full set of shapes in order, see the complete guide to candlestick patterns. For the two candle version of the same takeover logic, bullish and bearish engulfing candles has the exact rules, and hammer and shooting star candles covers the single candle rejection patterns that often form the star itself.
Questions people ask
What is the midpoint rule for a morning star?
The third candle must close above the midpoint of the first candle's body. If the first red body ran from 1.0880 down to 1.0840, the midpoint is 1.0860, and the green third candle needs to close above that price. A close below it means buyers recovered less than half of the original move, which is a bounce rather than a reversal sequence.
Does a morning star need gaps?
Not on forex or OTC pairs. The classic description came from markets that closed overnight, where the star candle gapped away from the first candle and then the third candle gapped back. On a 24 hour market each candle usually opens at the previous close, so the gaps rarely appear. What you require instead is that the star's body sits clear of the first candle's body and that the third candle clears the midpoint.
What is the difference between a morning star and a morning doji star?
The middle candle. In a morning doji star the star is a doji, so its open and close are the same price. That is a slightly stronger version of the same message, because the pause is complete rather than partial. Everything else about the sequence, including the midpoint rule on candle three, is unchanged.
Where is the invalidation on a morning star?
The low of the star, which is the middle candle. That is the price the sequence says buyers defended. A close below it means the pause did not mark the end of the selling and the read has failed. For an evening star the invalidation is the high of the star.
Do star patterns work on 1 minute charts?
They print, but they carry less information, because three 1 minute candles in a quiet hour can be built from very little trading. The sequence needs participants to mean anything. For short expiries, find the sequence on 5 or 15 minutes and use the 1 minute chart for entry timing rather than looking for the pattern there.
Why did my evening star fail?
Usually location. An evening star in the middle of a strong uptrend, with no resistance level above it and no prior high being swept, is three candles of profit taking inside a move that is still going. The pattern needs a level the sequence is reacting to, and it needs the structure of the trend to be in question, not just one period of hesitation.
Nothing here is financial advice. Signals and setups can be wrong, so only risk money whose loss will not change your life.