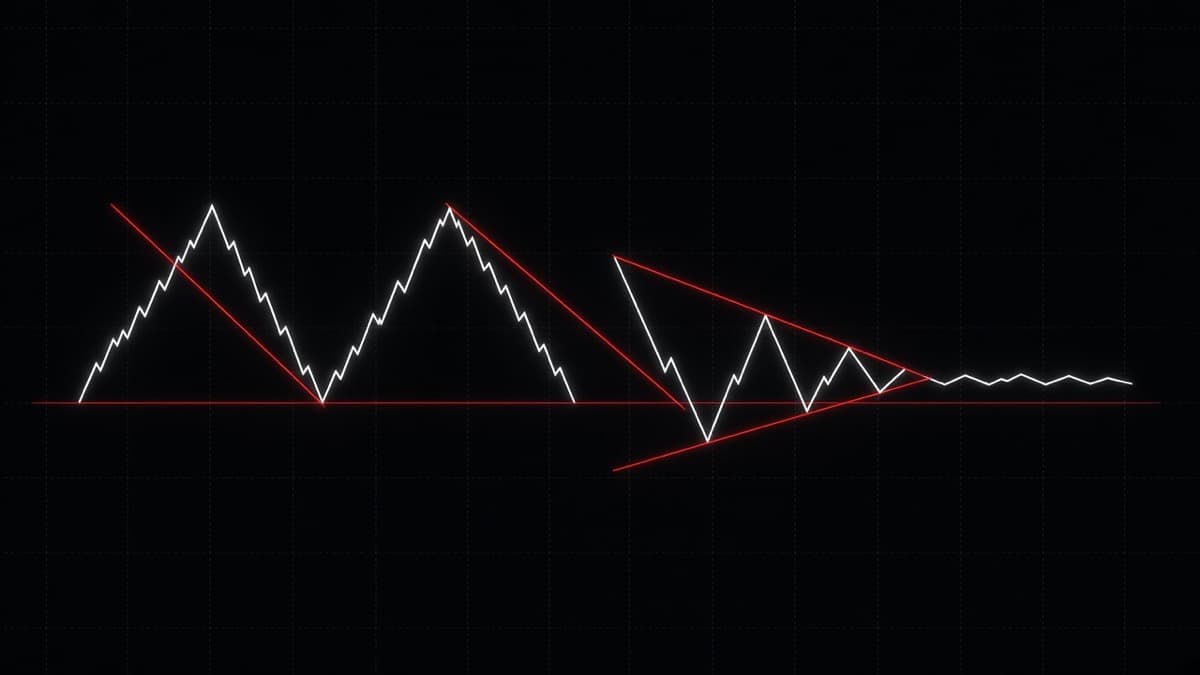
Chart Patterns: A Complete Guide for Traders
Chart patterns explained the way traders use them: continuation versus reversal, where the neckline sits, measured targets, and how breakouts fail.
 Home
Chart patterns from double tops to flags and triangles, including the neckline and breakout levels that decide whether the pattern paid.
Chart patterns explained the way traders use them: continuation versus reversal, where the neckline sits, measured targets, and how breakouts fail.
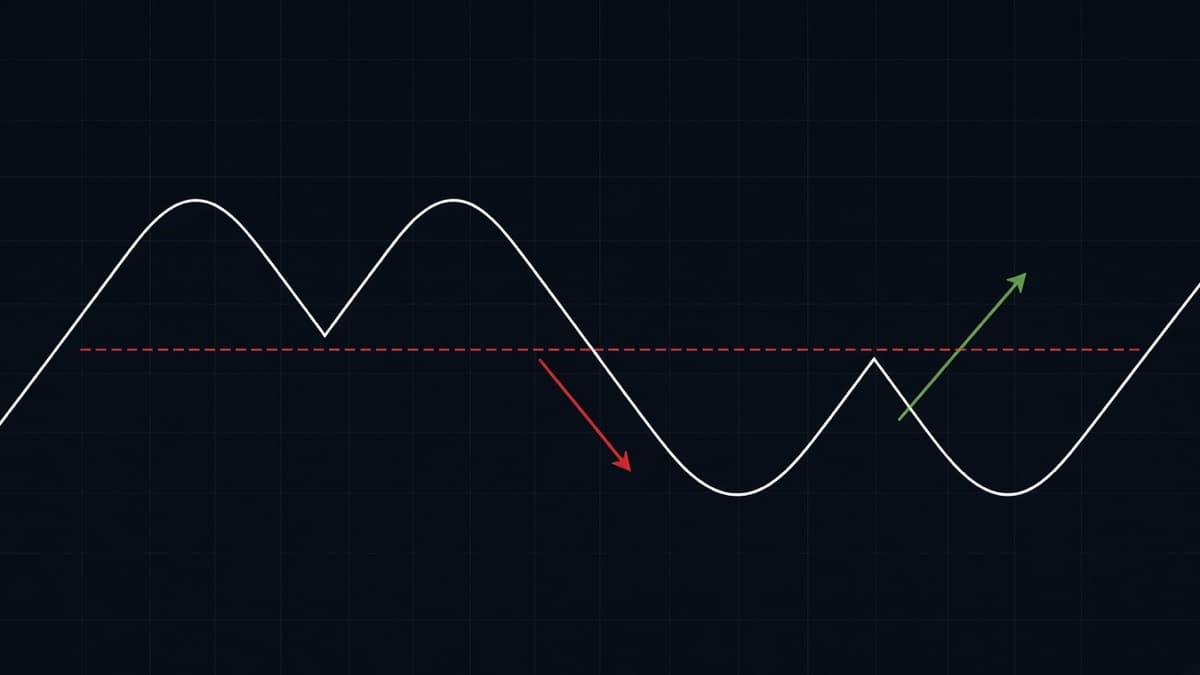
Double top and double bottom trading explained: where the neckline goes, why equal highs matter less than the break, retests, targets and the failed version.
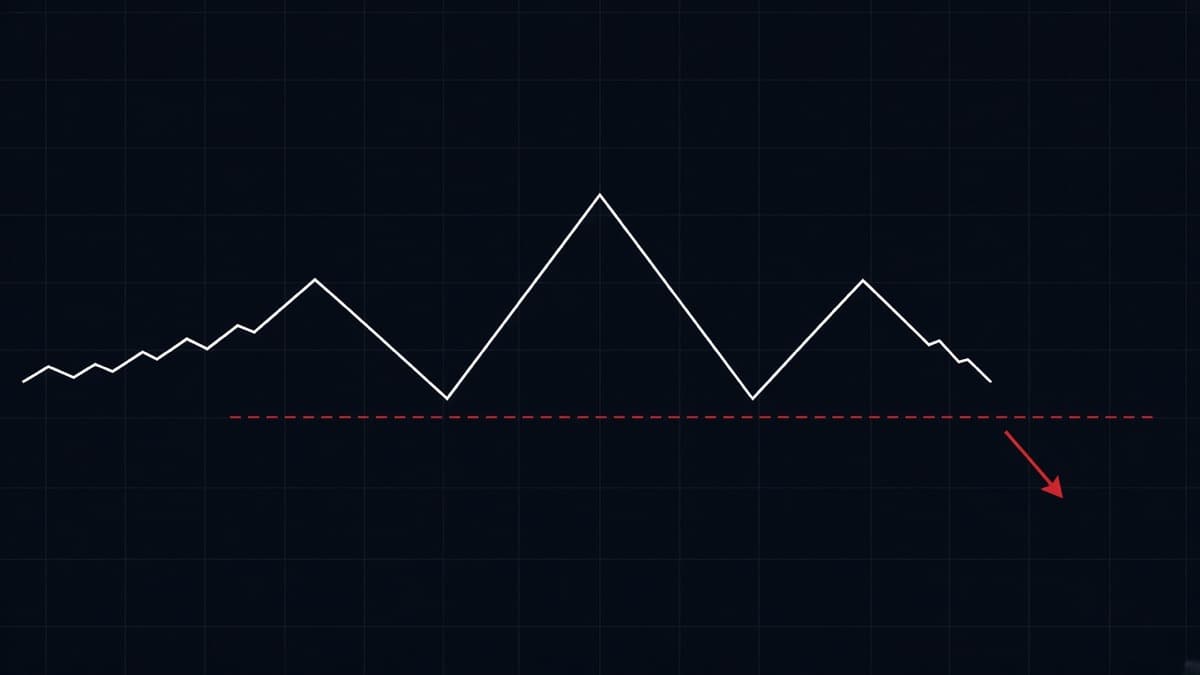
Head and shoulders explained by a trader: drawing the neckline, sloping necklines, the inverse pattern, measured targets, retests and what invalidates it.
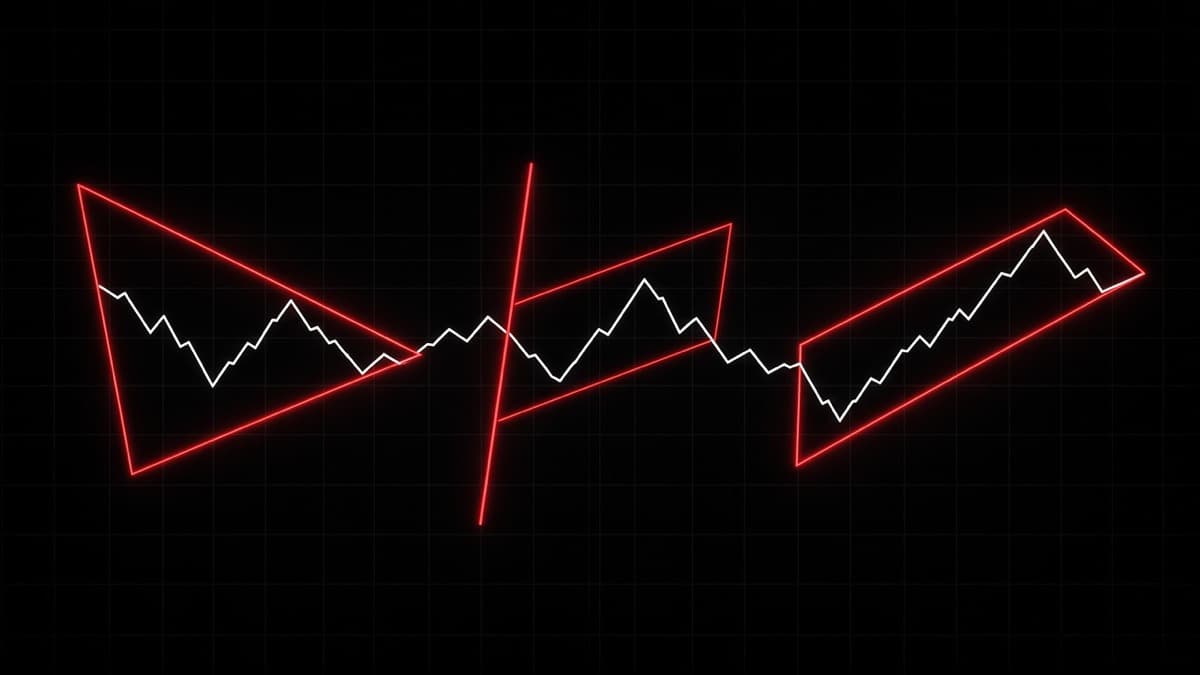
Ascending, descending and symmetrical triangles, bull and bear flags, wedges and pennants, plus how to tell a real squeeze from chop before you take the break.