Binary Options Expiry Times Explained: 30s to 1 Hour
How binary options expiry times change your odds: 30s, 1m, 5m, 15m and 1h compared, how to match expiry to the timeframe you read, and why good reads lose.
Expiry is the second half of every signal, and most traders only ever decide the first half. UP on EUR/USD is not a trade. UP on EUR/USD for the next 60 seconds is a trade, and UP on EUR/USD for the next 15 minutes is a completely different one with different odds, taken from the same chart at the same moment.
Four traders took that exact entry. Two of them are now writing in their journal that the setup does not work. The setup was fine. Their clock was wrong.
What does expiry actually mean on a fixed-time trade?
Expiry is the moment the platform stops caring what price does. It takes the price at that instant, compares it with your entry price, and pays or takes the stake. Nothing before that instant is counted. Price can spend 95 percent of the window in your favour and settle one tick against you, and that is a full loss.
That is different from anything you do in spot trading, where the whole path matters because you can act during it. Here the path only matters in one way: it determines where price happens to be standing when the bell rings. If you have not read what is binary trading yet, start there, because the fixed payoff and the fixed clock are the two halves of the same structure.
So the question for every trade is not just where is this going, it is where will this be at a specific second. That second is the one thing you fully control.
How does expiry change the odds?
Through one relationship: the size of the move you expect against the size of the market's normal wobble over that window.
Call the expected move M and the typical range over your window N. If M is much bigger than N, the direction at settlement is mostly determined by your read. If M is smaller than N, the direction at settlement is mostly determined by noise, and your read barely gets a vote.
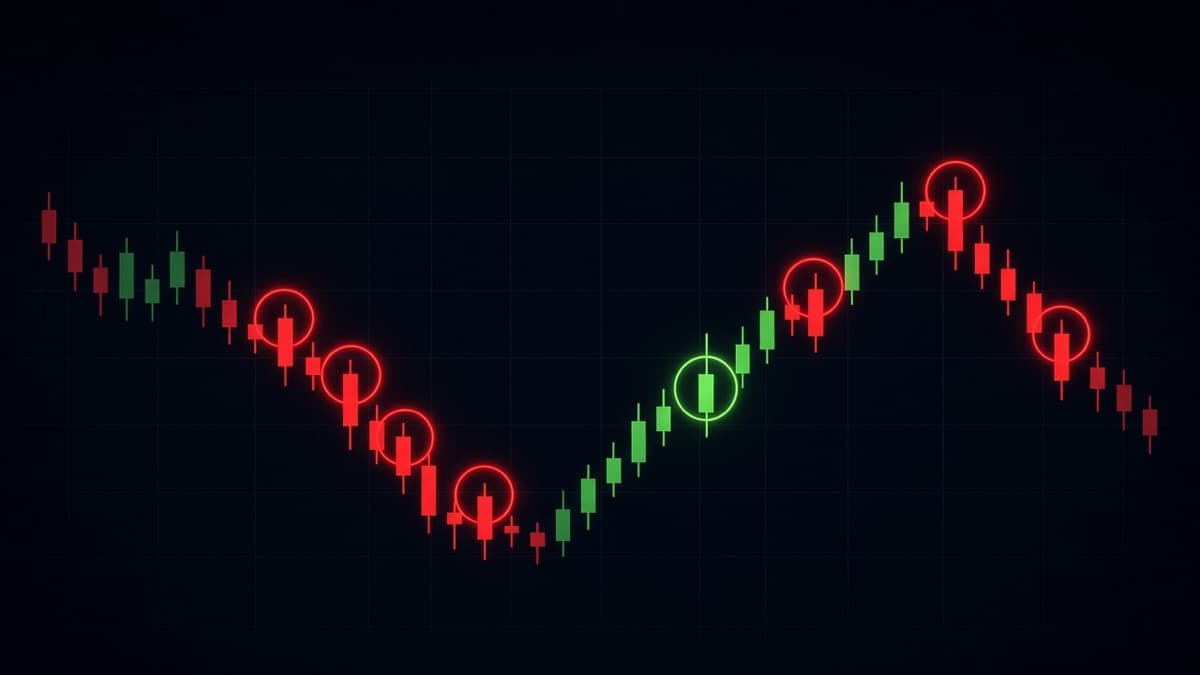
That chart is what a short window looks like when nothing is happening. The close sits above the entry line, then below, then above. None of it is information. If your settlement lands somewhere inside that, you have bought a coin flip at a losing price.
Put a number on the coin flip
A coin flip at an 85 percent payout has a fixed cost you can calculate. Expectancy per trade is:
(0.5 x 0.85) minus (0.5 x 1.00) = 0.425 minus 0.50 = minus 0.075
You lose 7.5 percent of your stake per trade, on average, forever. At $5 a trade over 100 trades that is an expected loss of $37.50 with no bad luck involved. At $20 a trade over 300 trades it is $450. The clock did that, not your analysis.
This is why the break-even maths from 1 / (1 + p) matters so much here. At an 85 percent payout you need about 54 percent winners. A clock that drags your true edge down toward 50 percent does not just reduce your profit, it flips the sign.
Measure your own noise instead of trusting a number
Do not take anyone's pip figures for this, including mine. Ranges change by pair, by session and by week. Measure it yourself, it takes two minutes:
- Open the pair on the timeframe closest to your expiry. For a 1 minute expiry, use the 1 minute chart.
- Look at the last 20 candles and note the range of a normal one, high to low, ignoring the two biggest.
- That is your noise number N for that window, right now, on that pair.
- Ask whether the move you are predicting is clearly bigger than N. If it is not, the expiry is too short for the trade.
GBP/JPY in the London open and EUR/USD in the Asian lull are not the same instrument for this purpose, even at the same expiry. If you want the session detail, forex pairs and trading sessions covers which hours actually move which pairs.
30 seconds: what are you really betting on?
On a 30 second clock you are betting that the next few ticks lean your way. Almost no chart pattern resolves in 30 seconds. What can resolve that fast is a reaction: the instant after a level breaks, the moment a spike gets rejected, the first seconds after a fast candle starts printing.
If you are going to use it, the conditions are narrow:
- The pair is actively moving, not drifting.
- You are entering into momentum that has just started, not after it has run.
- The move you expect is several times the size of a normal 30 second range.
Outside that, the 30 second button is the most expensive habit on the platform. It is also the most addictive, because the feedback comes fast enough to feel like a slot machine, which is a psychology problem more than a strategy problem. That side of it is covered in trading psychology and discipline.
1 minute: the workhorse, with one condition
A 1 minute expiry is the most useful short clock because a single 1 minute candle is a real unit of information. One candle can complete a rejection, finish an engulfing, or hold a level. You are betting on one candle close, which is a defined thing you can actually read.
The condition is that your read has to be about that candle. Not about the next ten minutes. If your reason is that price has broken structure on the 15 minute chart and should trend down all session, a 1 minute expiry is the wrong instrument for the idea. Fine read, wrong product.
Three dojis in a row on the 1 minute is the chart telling you to leave the clock alone. There is no directional information in that sequence, and a 1 minute call into it is the coin flip we just priced. Doji candlestick patterns goes through when that indecision matters and when it is just a quiet minute.
On the REDBERRY desk the Live tab is always a 1 minute call, which is deliberate. The signal is generated from realtime TradingView price and chart structure for the very next minute, so the expiry question is already answered and cannot be mismatched to the read. Everything you see on the Live tab is one candle of intent.
5 minutes: where structure gets room to work
Five minutes is usually the first clock where normal chart reading has space to be right. A move can pull back, hold, and continue inside a 5 minute window. A level can be rejected, retested and rejected again.
It is also the clock where the mismatch problem shows up most clearly in both directions. Traders read a 1 minute reversal candle and settle it in 5 minutes, which gives price time to reverse the reversal. Or they read a 5 minute rejection and settle it in 1 minute, which gives price no time at all.
Five minutes is the one I would start with if you are building a routine from scratch. Fast enough to get repetitions and data, slow enough that a decent read gets a fair hearing.
15 minutes: session logic instead of candle logic
By 15 minutes you are no longer trading a candle, you are trading a small piece of the session. The reasons that hold for 15 minutes are structural: a range high that has rejected three times, a break of structure with a clean retest, a level that lines up with the session open.
Three things change at this clock:
- Individual wicks stop mattering. A 20 pip spike against you can happen and mean nothing if the structure holds.
- Session boundaries start mattering a lot. A 15 minute trade taken five minutes before a major session opens is a trade with a new set of players arriving mid position.
- You take far fewer trades, which is usually an improvement.
1 hour and longer: a different job
An hour is long enough that the reason for the trade needs to be a market condition, not a candle. Trend continuation after a clean break, a return to a level that has held all day, a session with an obvious bias. This is the range where chart pattern work earns its keep, and where the chart patterns complete guide becomes directly useful, because patterns like a double top or a head and shoulders take hours to complete, not seconds.
The trade off is honest: you get far fewer setups and you cannot fix anything while you wait. No stop, no partial exit, an hour of nothing to do. Many traders find that harder than fast clocks, which tells you something about why they prefer fast clocks.
How many trades does each clock hand you?
This is the part of the expiry decision nobody talks about. The clock sets your trade count, and your trade count sets how fast everything happens to your account, good and bad.
On a 1 minute expiry with a short pause between trades, you can physically take 30 or 40 trades in an hour. At 2 percent a trade that is 60 to 80 percent of your balance cycled through the market in sixty minutes. On a 15 minute expiry you might take four setups in the same hour, and three of those hours might produce nothing worth taking.
Here is what the higher count does to your day, using a genuine 55 percent edge as the example. Over 40 trades the expected number of wins is 22, and the standard deviation is the square root of 40 x 0.55 x 0.45, which is about 3.2 wins. Break-even at an 85 percent payout needs roughly 21.6 wins out of 40. So a normal one deviation swing takes you from 19 wins to 25 wins, which is a clearly losing day to a clearly good one, with the same skill and the same setups. Fast clocks do not just produce more trades, they produce more of those days in a row, and they produce them before you have had time to think.
There is a second cost that does not show up in any formula. Forty decisions an hour is forty chances to break a rule. Four decisions an hour is four. Most traders who move from 1 minute to 5 or 15 minute clocks report the same thing: the win rate barely changed and the results improved, because the number of rule breaks collapsed.
The clocks side by side
| Expiry | What you are actually betting on | Needs | Main failure |
|---|---|---|---|
| 30s | The next few ticks leaning your way | Momentum already in motion | Noise larger than the move |
| 1m | One candle close | A read about that exact candle | Entering mid candle after the range is spent |
| 5m | A short move completing | A level or a signal candle to work from | Reversal of the reversal |
| 15m | A piece of the session | Structure, not a single candle | Session change mid trade |
| 1h+ | A market condition | Trend or a level with real history | Patience, and no way to adjust |
How do you match expiry to the timeframe you read?
Use this as a starting rule: the expiry should cover roughly two to five candles of the timeframe the signal came from. Two candles gives the move room to start. Five means you are still inside the reason you entered.
| Signal read on | Reasonable expiry | Why |
|---|---|---|
| 15 second chart | 30s to 1m | The reaction is immediate or it is nothing |
| 1 minute chart | 1m to 5m | One to five candles of follow through |
| 5 minute chart | 15m to 30m | Three to six candles for the move to complete |
| 15 minute chart | 1h | Structure needs hours, not minutes |
| 1 hour chart | 4h or a day | The reason is a session or a daily bias |
The direction of the error matters. Too short is worse than too long. Too short converts a correct read into a loss you cannot do anything about. Too long usually just dilutes the edge, and price often stays on the right side of the entry anyway once the move has happened.
A worked example on GBP/USD
Say GBP/USD has rejected 1.2680 twice during the New York session. The third tap prints a candle with a long upper wick that closes at 1.2672. You want DOWN. Before choosing a clock, two measurements:
- A normal 5 minute candle on this pair right now is running about 12 pips high to low.
- A normal 1 minute candle is about 4 pips.
The obvious target is the swing low at 1.2640, which is 32 pips away. At 12 pips of range per 5 minute candle, that move needs roughly three candles, so about 15 minutes of clock.
Now compare the two bets. A 1 minute expiry needs price below 1.2672 in 60 seconds, and 60 seconds of normal movement on this pair is 4 pips in either direction. You are asking a 4 pip coin to land on the right side. A 15 minute expiry needs price below 1.2672 after a move you expect to travel 32 pips. Same chart, same read, same rejection candle. One of those bets is about the market and the other is about noise.
Why does a correct read still lose on the wrong clock?
Because price does not travel in straight lines, and three specific things happen on the way.
The pullback before the move
Most real moves start with a shake. Price dips below the entry, takes the impatient traders out, then goes. On a 5 minute clock that dip is invisible in the result. On a 1 minute clock the dip is the result.
The sweep
If you are entering near a level where obvious stops are sitting, expect a poke through it first. That is the whole idea behind liquidity sweeps and stop hunts. You cannot avoid the sweep, but you can choose a clock that survives it, or wait for the sweep to happen and enter after it.
The late entry
When you enter on candle six of a five candle move, a short clock is settling into the most likely moment for a pullback. The read was right about the trend and wrong about where you are inside it. This is the most common version of the correct read that loses, and it shows up again in common binary trading mistakes.
Mid-candle entries and the clock you did not choose
There is a hidden clock nobody selects. If you take a 1 minute expiry 40 seconds into a candle, your trade does not settle at the close of that candle, it settles 60 seconds from now, which is 40 seconds into the next candle. Your read was about a candle close. Your settlement is somewhere in the middle of the following candle.
Two fixes, both simple:
- Enter in the first seconds of a new candle when your read is about that candle closing.
- Or pick an expiry long enough that a 40 second offset does not change the outcome, which usually means 5 minutes or more.
Most platforms also offer an end-of-candle style expiry on some instruments, where the trade settles at a fixed clock time rather than a fixed duration. If yours does, that removes the offset entirely. Check what your own platform is doing rather than assuming, because this detail changes your results more than any indicator setting.
Does expiry change the payout?
Payouts differ by instrument, by expiry and by session, and they change, so no honest article can tell you what yours will be. What you can do is treat the payout as part of the expiry decision rather than a separate thing:
- Read the payout for the expiry you are considering.
- Work out 1 / (1 + p) to get the win rate you need.
- Ask whether that clock realistically gets you above that number on this pair, right now.
A shorter clock that pays more is not automatically better. If the extra payout drops your break-even from 54 percent to 52.6 percent while the clock drops your real win rate from 57 percent to 50 percent, you took a worse trade for a bigger number. The sizing side of that decision is in risk management for binary trading.
What about news and session opens?
News changes the noise number, sometimes by a factor of several, and it changes it instantly. A window that was comfortably longer than the normal range at 13:29 can be a coin flip at 13:30.
Three practical rules that do not require a calendar subscription:
- If the last two candles are three or four times the size of the twenty before them, your noise number is out of date and every short clock just got worse.
- The first candle after a release is the least readable candle of the day. Both sides are in it, the spread is wide, and the wicks go everywhere. Waiting for it to close costs you nothing except a trade you did not want.
- The second and third candles after a release are often the best structure of the session, because the spike has usually swept the obvious levels and shown you which side is actually in control.
Session opens do something similar but slower. The London open pulls volume into the EUR and GBP pairs, so a 1 minute clock that was noise at 06:00 becomes tradable at 08:00. The overlap into New York is the same story again. None of that requires prediction, it just requires knowing which hour you are in, which is why the session map in forex pairs and trading sessions is worth having open next to the desk.
Expiry on the REDBERRY desk
Worth being precise about, because the two feeds behave differently.
The Live tab covers 17 FX pairs and the generate time is always 1 minute. It reads the TradingView API for realtime price and chart structure, then inbuilt strategies call the next move. You do not select a Live expiry, which removes the most common mismatch by design.
The OTC tabs are where you choose. Quotex OTC offers timeframes from 5 seconds up through 1 minute, 5 minutes, 15 minutes, an hour and beyond. The signal is generated from private Quotex API access to a live OTC price feed, with the same inbuilt strategies, and it holds for the timeframe you selected. So the clock is your call, which also means a 5 second selection is your call. The desk rules exist for a reason: Live account rather than broker demo, 1 to 2 percent risk per signal, and one step of MTG at most. Signals are not 100 percent accurate, and the shortest clocks are where that shows up hardest.
More on how the two feeds are built is in how REDBERRY generates live and OTC signals, and the platform by platform differences are in Quotex trading guide.
A starting rule set
If you want something to use tomorrow morning, use this and change it only when your own journal tells you to.
- Pick one expiry for the whole week. Five minutes is a sensible default.
- Only read setups on the timeframe that matches it. For 5 minutes, read the 1 minute and the 5 minute chart and nothing slower.
- Enter in the first seconds of a candle, not halfway through one.
- If the last 20 candles show a normal range bigger than the move you expect, skip the trade instead of shortening the clock.
- Log the expiry on every row of the journal. It is the column most people leave out, and it is usually the column that explains the losses.
- After 50 trades, split the log by expiry and compare each group against 1 / (1 + p).
That last step is where this stops being theory. When you can see that your 1 minute trades run at 48 percent and your 5 minute trades run at 58 percent on the same setups, the decision makes itself, and you will have found it in your own data rather than taking my word for it.
If something on the desk itself is unclear, the contact page is the place to ask rather than guessing at what a timeframe list means.
Questions people ask
What is the best expiry time for binary options?
There is no single best one. The expiry has to cover the time your setup needs to resolve, which depends on the chart you read it from. A signal read from 1 minute candles usually needs 1 to 5 minutes. A signal read from 5 minute candles usually needs 15 minutes or more. The mistake is picking an expiry by preference and then hunting for a setup to fit it.
Is a 30 second expiry ever worth taking?
Only when the move you are trading is much larger than the normal 30 second range on that pair, which in practice means the first seconds of a break from a tight range or a violent reaction candle. Outside that, a 30 second window is smaller than the noise and settlement is close to a coin flip, which loses money at any payout under 100 percent.
Should the expiry match the chart timeframe exactly?
Not exactly, it should cover it. A useful rule is that the expiry should span roughly two to five candles of the timeframe you read the signal on. Reading a 5 minute candle and settling in 60 seconds means you are betting on the first fifth of the candle you were looking at.
Why did my trade lose when the direction was right?
Because settlement happens at one instant, not across the window. If the move pulls back or sweeps a level before it goes, a short clock can settle inside the pullback while a longer clock settles after the move. The read was fine, the clock was too tight for the path price took.
Does a longer expiry mean a higher win rate?
Longer usually means less noise relative to the move, which helps. It is not automatic. A long expiry on a read that was only ever valid for two candles just gives price more time to undo it, and a long expiry in a range lets price wander back through your entry. Longer helps when the reason for the trade lasts that long.
What expiries does REDBERRY use?
The Live tab is always a 1 minute call on 17 FX pairs, using the TradingView API for realtime price and chart structure with inbuilt strategies on top. On the OTC tabs you choose the timeframe from that platform's list, and the same strategies run against the private Quotex OTC price feed. The signal holds for the timeframe you picked, so choosing it is your decision and your responsibility.
Nothing here is financial advice. Signals and setups can be wrong, so only risk money whose loss will not change your life.