Candlestick Patterns: The Complete Guide for Traders
Candlestick patterns explained with diagrams: candle anatomy, single, two and three candle setups, where each one works, and why context beats the shape.
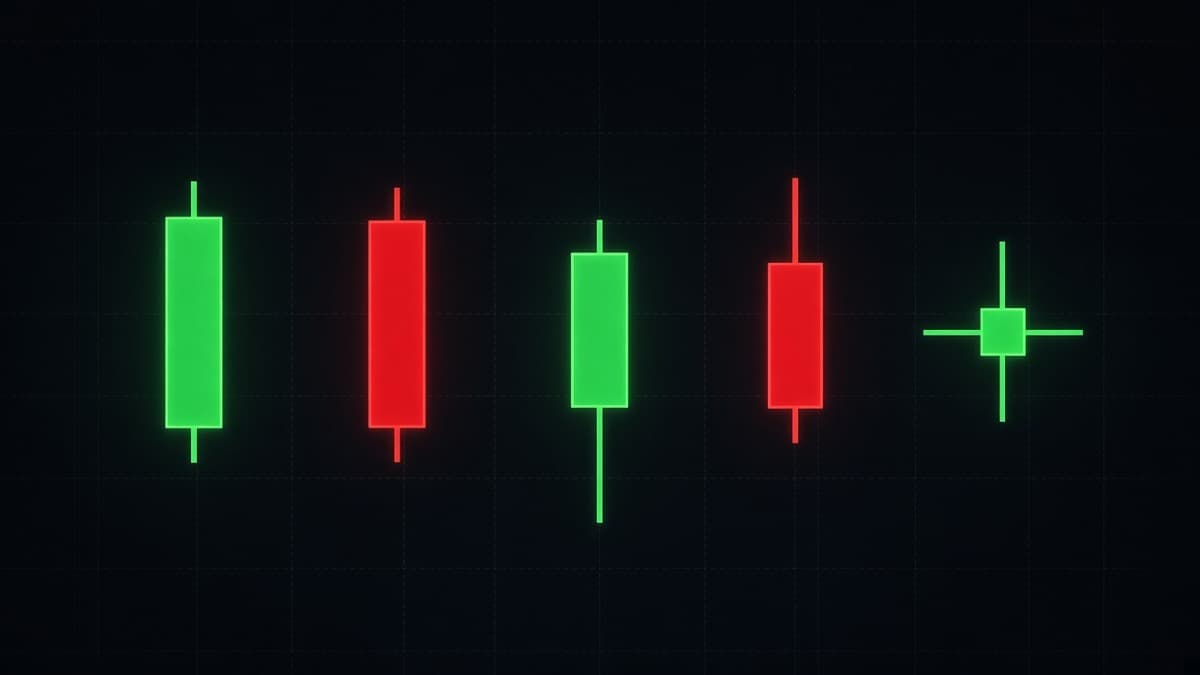
A candlestick pattern is a record of who lost control of a price range, and when. Nothing more. The green or red body tells you where the period opened and closed, the wicks tell you the prices that were reached and then rejected, and the pattern is just two or three of those records sitting next to each other in a place that matters.
That last part is where most traders go wrong. They memorise forty shapes, spot a hammer in the middle of a range, take the trade, and lose. The shape was correct. The location was worthless.
This guide covers candle anatomy first, then single candle patterns, then two and three candle patterns, then the part nobody puts on a cheat sheet: the conditions that make each one worth acting on and the conditions that make it noise. Every pattern here is drawn as a diagram so you can check the proportions against what the text claims.
What a candlestick actually tells you
One candle holds four prices for one period of time. Open, high, low, close. On a 5 minute chart, each candle is 5 minutes of trading compressed into one shape.
The body runs from the open to the close. Green means the close finished above the open, red means it finished below. The wicks, sometimes called shadows or tails, run from the body to the high and to the low. Those two thin lines are the prices the market touched and then walked away from.
The four prices, in order of importance
The close matters most. It is the only price both sides agreed to end the period on, and it is the price that every moving average, every indicator and most algorithms use. When people say a level "broke", they usually mean a body closed through it, not that a wick poked past it.
The open matters second, because the distance between the open and the close is the body, and body size is the clearest measure of conviction available on a bare chart.
The high and the low matter as boundaries. They mark where the move ran out, and they become the reference points for stops, for invalidation, and for the resting orders that other traders leave behind. That last point is worth reading more about in liquidity sweeps and stop hunts, because clusters of stops sitting just past an obvious high or low explain a lot of otherwise strange wicks.
Body size is the message
A wide body means one side pushed price a long way and held it into the close. A narrow body means price ended up close to where it started, whatever happened in between.
Compare two candles on EUR/USD 15 minutes. The first opens at 1.0840 and closes at 1.0862, with a high of 1.0863 and a low of 1.0839. Almost all of that range is body. Buyers took it and kept it. The second opens at 1.0840, runs to 1.0871, drops to 1.0836, and closes at 1.0842. Same pair, same timeframe, similar range, completely different information. The second candle says both sides tried and neither finished ahead.
What the wicks mean
A wick is a rejected price. Price traded there, and by the close it was no longer there.
A long lower wick means price fell into an area and came back out of it. Somebody was willing to buy down there in size. A long upper wick means the opposite. Price rose into an area and came back out, which is selling into strength.
The length that counts is relative, not absolute. A 6 pip lower wick on USD/JPY at 3am means very little. The same 6 pips on a 1 minute candle during a quiet hour can be the largest wick of the last hour. Always read the wick against the recent candles beside it, not against a fixed number of pips.
Timeframe changes the pattern, not the logic
The logic of body and wick is the same on every timeframe. What changes is how much trading went into the shape.
A 1 hour engulfing candle on GBP/USD is built from an hour of orders across the London session. A 1 minute engulfing candle at 2am is built from very few trades. Both are engulfing candles. Only one of them is evidence.
This is the single biggest practical adjustment to make. If you trade short expiries, and most binary traders do, use the 15 minute or 1 hour chart to decide the direction and the level, then drop to the 1 minute chart for entry timing. Deciding direction on the 1 minute chart alone puts you at the mercy of noise. The reasoning behind expiry choice is covered in binary options expiry times explained.
Single candle patterns
Single candle patterns say something about one period. On their own, that is a small amount of information, which is why the rules for using them lean so heavily on location.
Marubozu: a candle that is all body
A marubozu has a full body and almost no wicks. The open is at one extreme and the close is at the other.
A bullish marubozu means price opened, went one direction, and never gave anything back before the close. Nobody defended the range. That is a momentum reading, not a reversal reading, and it usually argues for continuation rather than a turn.
Where it matters most is on a break. If price has been stuck under 1.2650 on GBP/USD for two hours and then a 15 minute candle opens at 1.2648 and closes at 1.2679 with barely any wick, that break has weight behind it. If the break candle has a long upper wick instead, sellers were already pushing back before the candle even closed.
Where marubozu candles hurt people is chasing. By definition, the candle closes at its extreme, so entering at the close means entering at the worst price of the period. Waiting for a small pullback into the body is usually better than paying the high.
Spinning top: small body, wicks on both sides
A spinning top has a small body, roughly a quarter of the total range or less, with wicks of similar length above and below.
Price travelled in both directions and finished near the middle. It is a stalemate candle. In a trend, a single spinning top is usually a rest. Two or three in a row, with overlapping ranges, means the trend has stopped making progress and you are in a range until something breaks.
A spinning top on its own is never a trade. It is a reason to slow down and check whether the structure still supports the direction you had in mind.
A practical example. EUR/USD runs up through the London open on 5 minute candles, four wide green bodies in a row, then prints a spinning top, then another one with a range that sits almost entirely inside the first. Nothing bearish has happened. What has happened is that the easy part of the move is over, and the next 5 minute candle is far less predictable than the last four were. If you were planning a short expiry entry on momentum, that is the moment to stop taking them.
Doji: open and close at the same price
A doji is the extreme version of the spinning top. The open and close are the same price, or so close that the body is a thin line.
A doji says the period produced no winner. The useful part is where it prints. A doji in the middle of a trending leg means a pause. A doji right at a level price has already respected twice means the side that was in control just failed to make progress at exactly the point where failure matters.
Dojis also come in shapes that carry more information: long legged, dragonfly and gravestone. Those are worth separating properly, which is why doji candlestick patterns covers each one with its own diagram and its own conditions.
Hammer: long lower wick after a drop
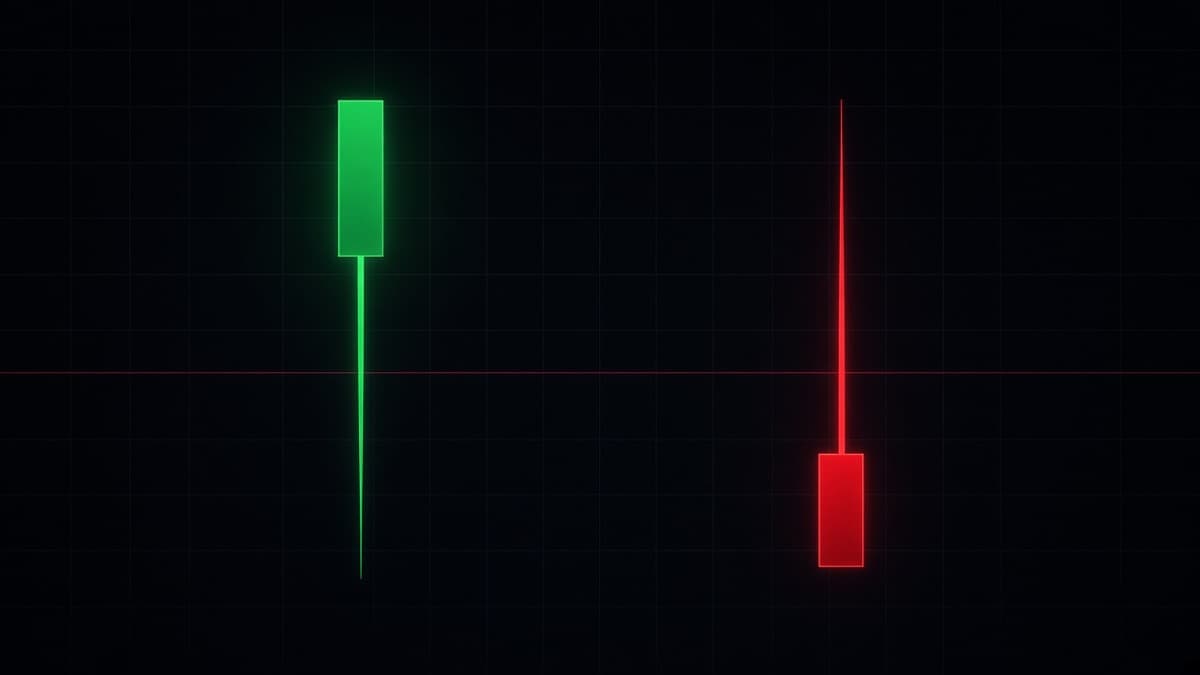
A hammer has a small body near the top of its range and a lower wick that is roughly two thirds or more of the total range. The upper wick is small or missing.
The story is simple. Sellers pushed price down during the period, buyers came in below, and by the close price was back near the top of the range. The sell-off inside the candle failed.
For a hammer to matter, three things need to be true. It has to appear after an actual decline, not in a sideways drift. The lower wick needs to reach into a level, an old low, a prior support, or a zone where price has reacted before. And the next candle needs to confirm by holding above the hammer low and preferably closing above the hammer body.
An isolated hammer with nothing under it is just a candle with a long tail. The wick to body ratios, the mirror cases, and the failure modes are all worked through in hammer and shooting star candles.
Hanging man: the same shape in the wrong place
A hanging man has the identical shape to a hammer, small body near the top, long lower wick, but it prints after a rally rather than after a drop.
Read what the wick means in that context. Price was up near the highs, and inside one period sellers were able to drag it a long way down before buyers recovered it. Buyers won the close, but they had to fight for it, and that is new information after a clean run of green candles.
A hanging man is a warning, not a trigger. Trading it needs the next candle to close back below the hanging man body. Without that, you are shorting an uptrend because one candle had a tail.
Shooting star: long upper wick after a run
A shooting star has a small body near the low of its range and an upper wick two thirds or more of the total range.
Buyers made a new high inside the period and lost the entire move. If that high sits at a resistance level, or just above an obvious prior high where stops would have been resting, the candle is telling you the breakout attempt was absorbed.
The condition that matters is the follow-through candle. A shooting star followed by a candle that closes above the star high has failed, and holding a short there is how a small loss becomes a large one.
Inverted hammer: the bottom side version
An inverted hammer has the shooting star shape, small body near the low with a long upper wick, but it prints after a decline.
It is the weakest of the four wick patterns, because the candle closes near its own low. Buyers tried, got price up, and could not hold it. That is not a strong bullish reading on its own. What makes an inverted hammer worth watching is a strong close on the candle after it, above the inverted hammer high. Without that, it is often just a pause inside a downtrend.
There is one situation where an inverted hammer earns more attention. If price has just swept a prior low, the low is holding, and then an inverted hammer prints with its upper wick pushing back into the broken level, the candle is showing an attempt to reclaim what was lost. That is a sequence, not a shape, and the sequence is what carries the information.
Single candle patterns at a glance
| Pattern | Shape | Prints after | What it says |
|---|---|---|---|
| Marubozu | Full body, no wicks | Any | One side held the whole period |
| Spinning top | Small body, wicks both sides | Any | Stalemate, progress stopped |
| Doji | Open equals close | Any | No winner in the period |
| Hammer | Small body up top, long lower wick | A decline | A sell-off inside the candle failed |
| Hanging man | Same as hammer | A rally | Sellers reached deep into the range |
| Shooting star | Small body down low, long upper wick | A rally | A push up was fully rejected |
| Inverted hammer | Same as shooting star | A decline | Buyers tried, did not hold the close |
Two candle patterns
Two candle patterns are stronger than single candles because the second candle is measured against the first. There is a reference point, which means there is a rule you can check rather than a shape you have to judge.
Bullish engulfing
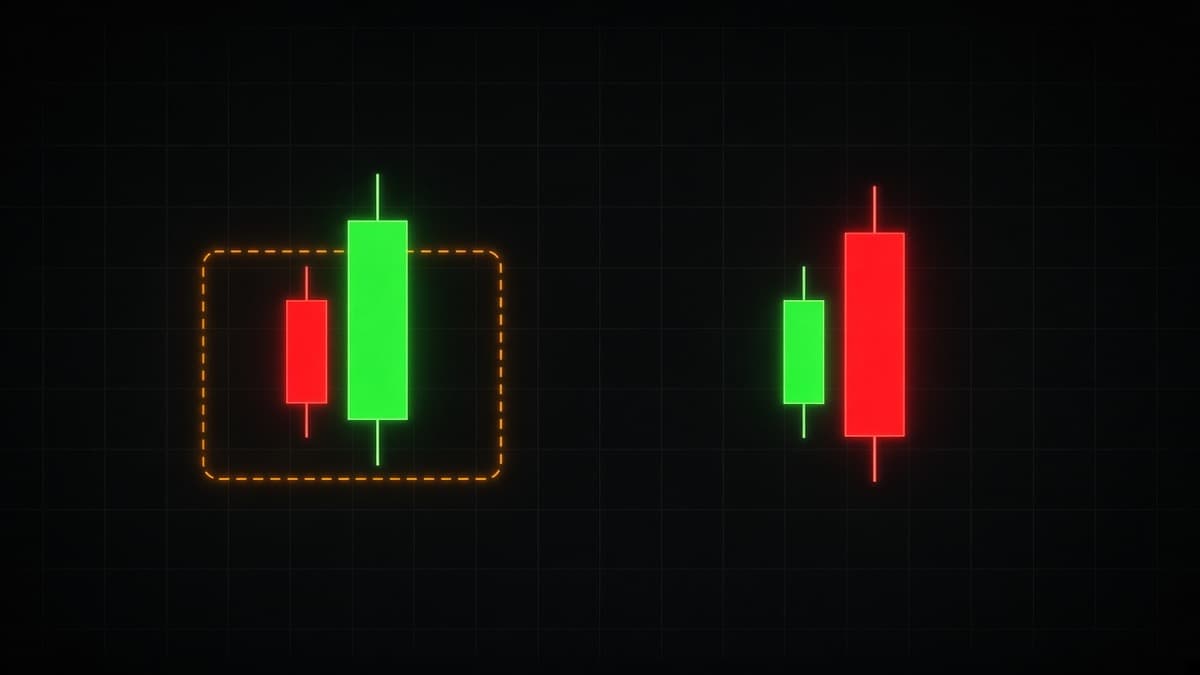
A bullish engulfing candle opens at or below the previous close and closes above the previous open, so its body covers the body of the red candle before it.
What happened inside the period: sellers had control at the open, and by the close buyers had taken back the entire previous period and more. On a 1 hour chart that is an hour of selling undone in an hour of buying.
The rules that matter:
- The engulf must be on the bodies, not the wicks. A candle with a huge range and a small body is not an engulfing candle even if its wicks swallow everything.
- The previous candle should be red. Engulfing a doji is weaker, because there was almost no body to take back.
- The engulfing candle should close in the top third of its own range. A close in the middle means sellers were already pushing back.
- There should be a level. A bullish engulfing at a support that has held before is a setup. The same candle in open air is a shape.
Bearish engulfing
The mirror. The green candle is followed by a red candle that opens at or above the previous close and closes below the previous open.
The same four rules apply in reverse. One extra note for anyone trading short expiries: bearish engulfing candles are common at the end of a session, when the traders who drove the move stop participating. That is a real effect worth knowing rather than a pattern property, and the session timings are laid out in forex pairs and trading sessions.
Full entry rules, the body versus wick problem, and the most common false signals are covered in bullish and bearish engulfing candles.
Piercing line and dark cloud cover
These are partial engulfing patterns. The second candle does not take back the whole previous body, only more than half of it.
A piercing line needs the green candle to open below the previous close and close above the midpoint of the previous red body. Dark cloud cover is the reverse at a top: the red candle opens above the previous close and closes below the midpoint of the previous green body.
Treat both as weaker versions of engulfing. Same logic, less of it. They earn attention when they show up at a level that has already produced a reaction, and they are easy to ignore anywhere else.
Tweezer tops and bottoms
A tweezer is two adjacent candles that share almost the same high, at a top, or almost the same low, at a bottom, with opposite closes.
The information is precise. Price reached exactly the same price twice in a row and turned away both times. That is a level being defended inside two periods rather than across two days. Tweezers are easy to spot and easy to over-trade, so the filter is the same as always: the matched price needs to mean something on the higher timeframe.
Harami: an inside candle
A harami is a small candle whose entire range fits inside the previous candle's body. A bullish harami is a small candle inside a long red body after a decline. A bearish harami is a small candle inside a long green body after a rally.
The reading is that the previous period's push produced no follow-through at all. The range contracted. What matters next is which side of the small candle gets broken, because a harami is a coiled range more than a directional signal.
Three candle patterns
Three candle patterns put a pause between the old direction and the new one. That middle candle is what makes them worth more than a two candle shape, because it shows the previous trend stopped before the reversal started.
Morning star
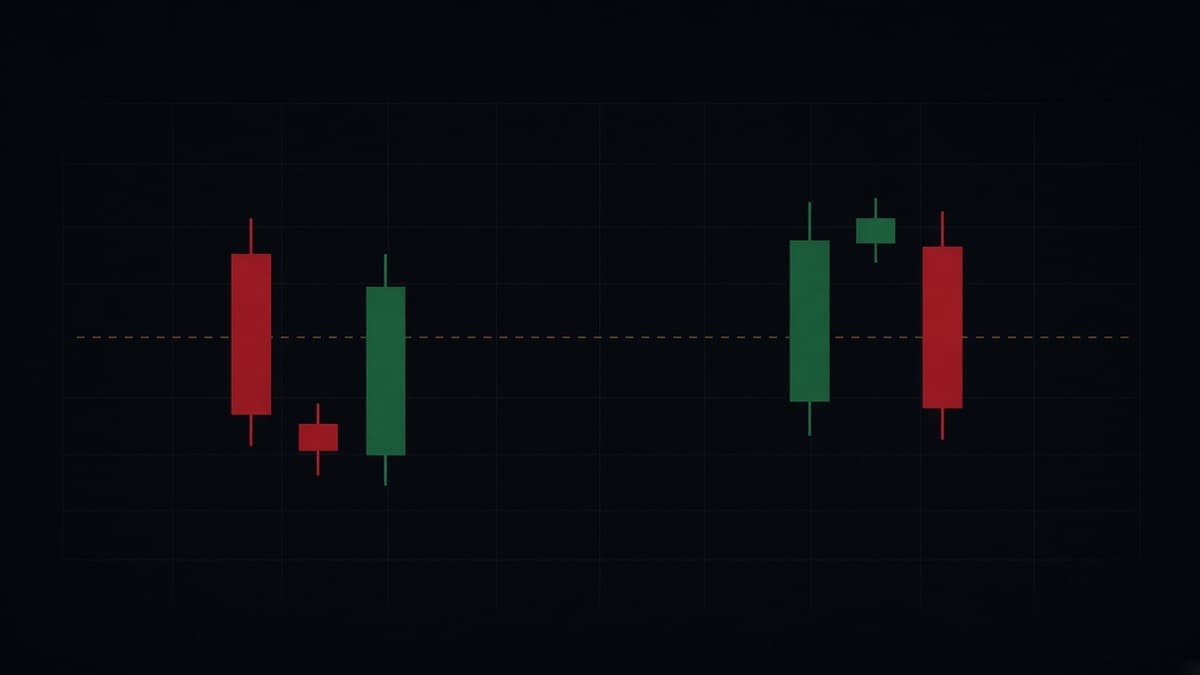
Three candles at a bottom. A long red candle, then a small bodied candle that sits below it, then a long green candle that closes back above the midpoint of the first red body.
Read it as a sequence. Candle one: sellers in control. Candle two: sellers stopped making progress, price went nowhere. Candle three: buyers took back half or more of the original move in a single period.
The midpoint test on candle one is the part people skip. If candle three closes only slightly above the star, you have a small bounce, not a morning star. The close needs to clear the halfway point of the first candle's body.
Evening star
The top side version. Long green candle, small body above it, then a long red candle closing back below the midpoint of the green body.
The same midpoint rule applies, and the same warning: on 24 hour markets like forex and OTC pairs, candles usually open at the previous close, so you rarely get the textbook gaps drawn in older books. That does not invalidate the pattern, but it changes what you should be looking for. Morning star and evening star patterns works through the gap question and how the sequence behaves on short binary expiries.
Three white soldiers and three black crows
Three long green candles in a row, each opening inside the previous body and closing near its own high, is a three white soldiers sequence. The crows version is three long red candles doing the reverse.
These are continuation and initiation patterns rather than reversals. Coming out of a tight base, three strong closes in a row is real evidence that a new direction has started.
The trap is obvious once you see it. By the third candle, price has already moved a long way, and the natural entry sits at the worst price of the run. Either take the second candle with a defined invalidation, or wait for a pullback into the first candle's range. Chasing the third soldier is how traders buy tops.
Reversal or continuation: a better way to sort patterns
Most cheat sheets sort candles into bullish and bearish. That split is close to useless in practice, because a bullish candle in a downtrend and a bullish candle in an uptrend ask for completely different trades.
Sort them this way instead.
Rejection patterns are candles that tried something and failed. Hammer, shooting star, hanging man, inverted hammer, gravestone and dragonfly doji all belong here. They print at the edge of a move, they need a level to reject from, and they need the next candle to confirm that the rejection stuck.
Takeover patterns are candles that reversed the previous period outright. Engulfing, piercing line, dark cloud cover, tweezers and the star sequences belong here. They are measured against a previous candle, which means the rule is checkable, and they tend to matter more than rejection patterns because a close has already gone past something.
Stall patterns produced nothing. Doji, spinning top and harami. They do not tell you direction. They tell you the previous direction stopped, which is useful mainly as a filter that keeps you out of a trade you were about to force.
Drive patterns are candles that show one side in full control. Marubozu, three white soldiers, three black crows. These argue for continuation, and the risk in them is the entry price rather than the read.
Once you sort by what the candle did rather than by its colour, the right question becomes obvious for each group. Rejection patterns need a level. Takeover patterns need a meaningful close. Stall patterns need patience. Drive patterns need a better entry.
Where candlestick patterns actually work
The pattern is the trigger, not the reason. Here is what needs to be in place before the trigger is worth anything.
At a level that has already done something
A level is a price where something previously happened: a swing high or low, the edge of a range that held twice, a level that flipped from resistance to support.
A reversal candle at that price is a reversal candle with a reason. The same candle 20 pips away from anything is a coin flip with a name. If you want to build the level map properly, chart patterns explained covers the structures that produce levels worth marking, and order blocks explained covers the zone version of the same idea.
In the direction of the higher timeframe
A bullish engulfing candle inside a 1 hour uptrend is a continuation signal after a pullback. The identical candle inside a 1 hour downtrend is a counter-trend trade against the dominant flow.
Both can work. They are not the same trade, they do not deserve the same size, and they do not deserve the same expectations.
After liquidity has been taken
Reversal candles print best right after price has run through an obvious high or low and immediately come back.
The wick through the level does two jobs. It triggers resting stop orders, which provides the volume needed to fill larger positions, and it makes the level look broken to anyone watching the price alone. When the candle closes back inside the range, the move that looked like a breakout was the entry for the other side. This is the mechanic behind a lot of good hammers and engulfing candles, and it is covered properly in smart money concepts.
With a close that means something
Ask one question about every pattern before taking it: did the close go past a price that other traders care about?
A bullish engulfing that closes above the last three candle highs has done something. A bullish engulfing that closes inside the previous three candles has just filled in a range. The shape is the same. The consequence is not.
Where candlestick patterns fail
Patterns fail constantly. That is not a flaw in the pattern, it is how a probabilistic edge works. What matters is recognising the conditions where failure is more likely, so you can skip the setup or size it smaller.
In the middle of a range
This is the most expensive mistake in candlestick trading.
The candle in that diagram passes every rule in the engulfing checklist. It opens below the prior close, closes above the prior open, closes in the top of its range. And it fails, because there was nothing under it. Sellers who wanted out had not finished, and no buyer had a reason to defend that specific price.
Before taking any reversal candle, find the level it is reacting to. If you cannot point at one, you do not have a setup.
Against strong momentum
A single reversal candle inside a strong trend is usually a pause. Three consecutive wide red bodies on GBP/JPY 15 minutes, then one green engulfing candle, is not a reversal. It is one period of profit taking inside a move that is still going.
Momentum needs to break before it turns. In practice that means a failure to make a new extreme, then a break of the last pullback level, and only then is a reversal candle worth trading in the new direction.
On low activity hours
Candle shapes formed on very little trading are unreliable. Wick lengths, body sizes and the entire pattern can come from a handful of ticks. The 2am to 5am window on most pairs produces plenty of pretty shapes that resolve into nothing.
When you are reading the candle you want to see
The honest failure mode. If you are already long and looking for a reason to stay long, you will find a hammer. Every trader does this. The fix is mechanical, not motivational: write down the invalidation price before you enter, and the candle stops being a matter of opinion. Trading psychology and discipline goes into why this specific error repeats.
Do candlestick patterns still work?
They work in the sense that they describe something real, which is where price opened, where it was rejected, and where it closed. That information has not changed and cannot be arbitraged away, because it is a description rather than a prediction.
What has changed is how many people are looking at the same shapes. When a pattern is obvious, the stops that go with it are obvious too. A crowd of traders buying a hammer will place their stops just under the hammer low, and that cluster becomes a target for anyone who wants to fill a larger position at a better price. This is why so many good looking reversal candles get their low taken out before price finally goes the intended direction.
The practical answer is not to abandon patterns. It is to stop treating them as entry buttons. Use the pattern as evidence about who is in control near a level you already marked, and place your invalidation where it will not be reached by a normal wick. If your stop sits one pip under an obvious hammer low on GBP/JPY, you should expect it to be hit routinely, not because the pattern failed but because that is exactly where the orders are.
The other honest answer is that a lot of published pattern statistics are not worth much. They usually define the pattern loosely, ignore location entirely, and test over a period that happened to suit one market condition. Read the candle in front of you. That is more reliable than a win rate someone posted with no definitions attached.
How context beats the shape
Run every pattern through the same short check. It takes ten seconds and it removes most bad trades.
- Where is it? At a level, or in open air? If you cannot name the level, stop.
- What is the higher timeframe doing? With the trend, or against it?
- What did the close do? Past something that matters, or nothing?
- Was liquidity taken first? Did a wick run an obvious high or low just before?
- Where does the idea die? Name the price. Usually the pattern low or high.
- Is this hour worth trading? Session open, or dead time?
A pattern that answers all six is worth normal size. A pattern that answers three is worth half size or a pass. A pattern that answers one is not a trade, it is a shape you noticed.
The order matters too. Find the level first, then wait for the candle. Traders who scan for candles and then hunt for a level to justify them are working backwards, and the level they find will always be the wrong one.
Reading candles on short binary expiries
Binary trading compresses everything. There is no partial exit, no trailing stop, and no way to be right slowly. The candle either resolves your way before the clock runs out or it does not, which changes how patterns should be used.
Three adjustments that help:
- Pick direction on a higher timeframe than you trade. Use 15 minutes or 1 hour for the bias and the level, then the 1 minute candle for timing. Deciding direction from 1 minute candles alone is reading noise.
- Match the expiry to the pattern's timeframe. A hammer on a 5 minute chart is saying something about the next few 5 minute candles, not about the next 30 seconds. A 30 second expiry on a 5 minute signal is a different bet from the one the pattern described.
- Respect the close. Most patterns are only complete when the candle closes. Entering mid-candle because it looks like it will be an engulfing candle is guessing what the close will be.
Position sizing carries more weight here than pattern selection, because a fixed payout structure punishes streaks differently from a normal stop and target. Risk management for binary trading covers the maths, and common binary trading mistakes covers the behaviour that undoes it. If you are new to the format, start with what is binary trading.
How REDBERRY reads candle structure
REDBERRY is a non-profit informational signal desk, not a broker, and it does not place trades for anyone. What it does is read live price and chart structure, then run inbuilt strategies over it.
For Live pairs, the desk uses the TradingView API for realtime price and chart structure, so the algorithm can read the market as it prints. For OTC pairs, it uses private Quotex API access for a live OTC price feed, plus the same inbuilt strategies. Live generate time is 1 minute on the 17 Live FX pairs. OTC runs on the pair and timeframe you select.
Candle structure is part of what those strategies read, because body and wick relationships are the raw material of any price based method. Signals are not 100% accurate, and no desk or pattern gets a guaranteed read on the next candle. The point of learning to read candles yourself is not to second guess a signal. It is to know when the chart in front of you is clean and when it is chop, because that changes how much risk a position deserves. The mechanics are described in how REDBERRY generates Live and OTC signals.
One note on OTC specifically. Quotex OTC pairs run their own feeds, so the candle rhythm on an OTC chart is not identical to the Live chart for the same currency pair. Read the pattern on the chart you are trading. Comparing the two platforms is covered in Quotex trading guide.
A practice routine that actually builds skill
Reading candles is a skill of repetition, and most traders skip the repetition part because it is slow and unexciting.
- Pick one pair and one timeframe. EUR/USD on 15 minutes is a reasonable start. One chart, for two weeks.
- Mark levels before the session, not during it. Swing highs, swing lows, the edges of yesterday's range. Five or six lines is enough.
- Wait for price to reach a line. Do nothing until it does. Most of the chart is not your business.
- Screenshot the candle that prints there. Name it. Write one sentence on what the body and wick say.
- Screenshot the next three candles. Did the read hold? Where exactly did it fail if it failed?
- Review weekly. Sort by pattern and by location. The pattern that keeps working for you on that pair will show up quickly, and so will the one you keep forcing.
After a month of that, you will notice something. You stop naming patterns and start reading candles directly. A long wick into a level with a strong close is a long wick into a level with a strong close, whether or not it fits a named category. That is the actual skill, and the names were only ever a way to learn it.
Quick reference
| Pattern | Candles | Direction | Key condition |
|---|---|---|---|
| Marubozu | 1 | Continuation | Full body, close at the extreme |
| Doji | 1 | Neutral | Open equals close |
| Spinning top | 1 | Neutral | Body under a quarter of the range |
| Hammer | 1 | Bullish | After a decline, lower wick two thirds of range |
| Hanging man | 1 | Bearish warning | After a rally, needs a lower close next |
| Shooting star | 1 | Bearish | After a rally, upper wick two thirds of range |
| Inverted hammer | 1 | Bullish, weak | After a decline, needs a strong next close |
| Bullish engulfing | 2 | Bullish | Body closes above the previous open |
| Bearish engulfing | 2 | Bearish | Body closes below the previous open |
| Piercing line | 2 | Bullish, weaker | Closes above the midpoint of the red body |
| Dark cloud cover | 2 | Bearish, weaker | Closes below the midpoint of the green body |
| Tweezer top | 2 | Bearish | Matched highs, opposite closes |
| Tweezer bottom | 2 | Bullish | Matched lows, opposite closes |
| Bullish harami | 2 | Bullish, weak | Small candle inside the previous red body |
| Bearish harami | 2 | Bearish, weak | Small candle inside the previous green body |
| Morning star | 3 | Bullish | Third close above the midpoint of candle one |
| Evening star | 3 | Bearish | Third close below the midpoint of candle one |
| Three white soldiers | 3 | Bullish continuation | Three strong closes near the highs |
| Three black crows | 3 | Bearish continuation | Three strong closes near the lows |
Where to go next
Each of these takes one part of this guide and goes deeper, with the exact rules and the failure cases drawn out:
- Bullish and bearish engulfing candles for the body versus wick question, entry and invalidation, and the false signals that repeat.
- Hammer and shooting star candles for wick to body ratios, hanging man and inverted hammer, and why an isolated hammer means almost nothing.
- Doji candlestick patterns for long legged, dragonfly and gravestone, and what indecision means inside a trend versus at a level.
- Morning star and evening star patterns for the three candle sequence, the midpoint rule, and how gaps behave on 24 hour markets.
A short note on where these names come from. Candlestick charting developed in Japanese rice trading long before it reached Western markets, and the patterns became widely known to English speaking traders largely through the work of Steve Nison. The vocabulary is borrowed, sometimes awkwardly translated, and occasionally invented by whoever wrote the last cheat sheet. Do not treat a name as proof that a pattern works. Treat the body, the wick, and the level as the evidence.
Questions people ask
What is the most reliable candlestick pattern?
No single pattern is reliable on its own. The patterns that hold up best are the ones that print at a level price has already respected, in the direction of the higher timeframe trend, with a close that goes past a price other traders were watching. An engulfing candle at a tested support is a different trade from the same engulfing candle in the middle of a range, even though the shape is identical.
How many candlestick patterns do I actually need to know?
Five or six. Candle anatomy, engulfing, hammer and shooting star, doji, and the morning and evening star sequence cover most of what shows up on a normal chart. Learning fifty named patterns does not improve reading. Knowing what a long wick and a wide body mean does.
Do candlestick patterns work on 1 minute charts?
They appear, but they are noisier. A 1 minute candle can be formed by a handful of ticks in a quiet hour, so the shape carries less information than the same shape on 15 minutes or 1 hour. If you trade short expiries, use the higher timeframe to pick the direction and the level, then use the 1 minute candle only for timing.
What is the difference between a hammer and a hanging man?
Nothing in the shape. Both have a small body near the top of the range and a long lower wick. A hammer prints after a sell-off, where the long lower wick shows buyers absorbing supply. A hanging man prints at the top of a rally, where the same wick shows sellers were able to push price a long way down inside one candle. The location gives it the name and the meaning.
Can a candlestick pattern be invalidated?
Yes, and knowing the invalidation point is more useful than knowing the name. For a hammer or engulfing candle, a close back through the low of the pattern candle means the read was wrong. For a morning star, a close below the low of the small middle candle does the same thing. If you cannot say where the idea dies, you do not have a trade.
Are candlestick patterns useful on OTC pairs?
They are readable, but treat them carefully. OTC pairs run their own feed with their own rhythm, so wick behaviour and range size differ from the Live forex chart for the same currency pair. Read the pattern in the context of that OTC chart, not the Live one, and keep your risk per position small.
Nothing here is financial advice. Signals and setups can be wrong, so only risk money whose loss will not change your life.