ICT Trading Concepts: Killzones, OTE and Power of 3
ICT trading concepts explained plainly: session killzones in UTC, the judas swing, optimal trade entry, power of three and the market maker buy and sell models.
ICT is shorthand for Inner Circle Trader, the name Michael J. Huddleston publishes under. Over the last decade a large vocabulary has grown out of that teaching: killzones, judas swing, optimal trade entry, power of three, market maker buy and sell models, along with much of the order block and fair value gap language that also appears under the smart money concepts label.
This article covers the concepts themselves, in plain terms, with the parts that are testable separated from the parts that are just a description of a pattern. I am not going to quote anyone or reconstruct anything from the courses. The point is whether the ideas are useful on a chart.
Where the terminology comes from
The ICT body of work is a teaching framework, not a published methodology with a fixed definition. Different people use the same terms slightly differently, which is worth knowing before you argue with someone about what a breaker block is.
Some of the vocabulary is genuinely original to that teaching, killzones and judas swing among them. Some of it is older ideas relabelled. Optimal trade entry is a Fibonacci retracement band. Order blocks are supply and demand zones marked more precisely. Liquidity sweeps are stop runs, which traders have described for as long as there have been stops.
None of that is a criticism. Renaming an idea in a way that makes people apply it more carefully has real value. What you should avoid is treating the framework as a closed system that explains everything. Test the pieces separately and keep the ones that hold up on your pair at your hours.
Killzones and session timing
The most useful ICT contribution, in my view, is the emphasis on when you trade rather than what you trade.
Currency markets do not move evenly through the day. Most of the range on a major pair gets built during two windows: the hours around the London open and the hours around the New York open. Outside those, price often drifts in a tight range where technical levels produce small, slow reactions.
The windows in UTC
The killzones are defined in New York local time, which means they move against UTC twice a year. Here are the commonly quoted windows, given first for northern hemisphere winter, when New York is on Eastern Standard Time.
| Window | New York time | UTC (winter) | UTC (summer) |
|---|---|---|---|
| Asian range | 20:00 to 00:00 | 01:00 to 05:00 | 00:00 to 04:00 |
| London killzone | 02:00 to 05:00 | 07:00 to 10:00 | 06:00 to 09:00 |
| New York AM killzone | 07:00 to 10:00 | 12:00 to 15:00 | 11:00 to 14:00 |
| London close | 10:00 to 12:00 | 15:00 to 17:00 | 14:00 to 16:00 |
Two things to be careful about. First, the UTC columns shift by an hour when daylight saving is in effect, and the United States and the United Kingdom change on different dates, so for a couple of weeks each spring and autumn the usual relationship is off by an hour. Check the actual clock rather than trusting a table.
Second, the broader session hours are separate from the killzones. The London session as a whole runs roughly 08:00 to 17:00 UTC in winter and 07:00 to 16:00 in summer. New York runs roughly 13:00 to 22:00 UTC in winter. The killzone is a narrower window inside the session where the expansion usually happens. Which pairs are active in which session is covered in forex pairs and trading sessions.
What a killzone is and is not
It is: a statement that volatility clusters. That part is not controversial. Volume and range genuinely concentrate around the session opens, and you can verify it on any pair with a few days of data.
It is not: a guaranteed edge. Being inside the London killzone does not make a bad setup good. It makes the moves bigger, which cuts both ways. A losing trade inside a killzone loses faster.
The useful way to use it is as a filter on when to be at the screen, not as a signal. If your setup appears at 04:00 UTC in a 9 pip Asia range, it will probably produce a 4 pip reaction. The same setup at 07:30 UTC has room to run. Same pattern, different environment.
The other honest point: killzone windows are not a secret. Every intraday trader knows the market moves at the London open. The value is in the discipline of only trading then, which is a behavioural benefit rather than an informational one, and behaviour is where most accounts are actually won or lost. That side is covered in trading psychology and discipline.
The judas swing
The judas swing is the first move after a session opens, when that move goes the wrong way.
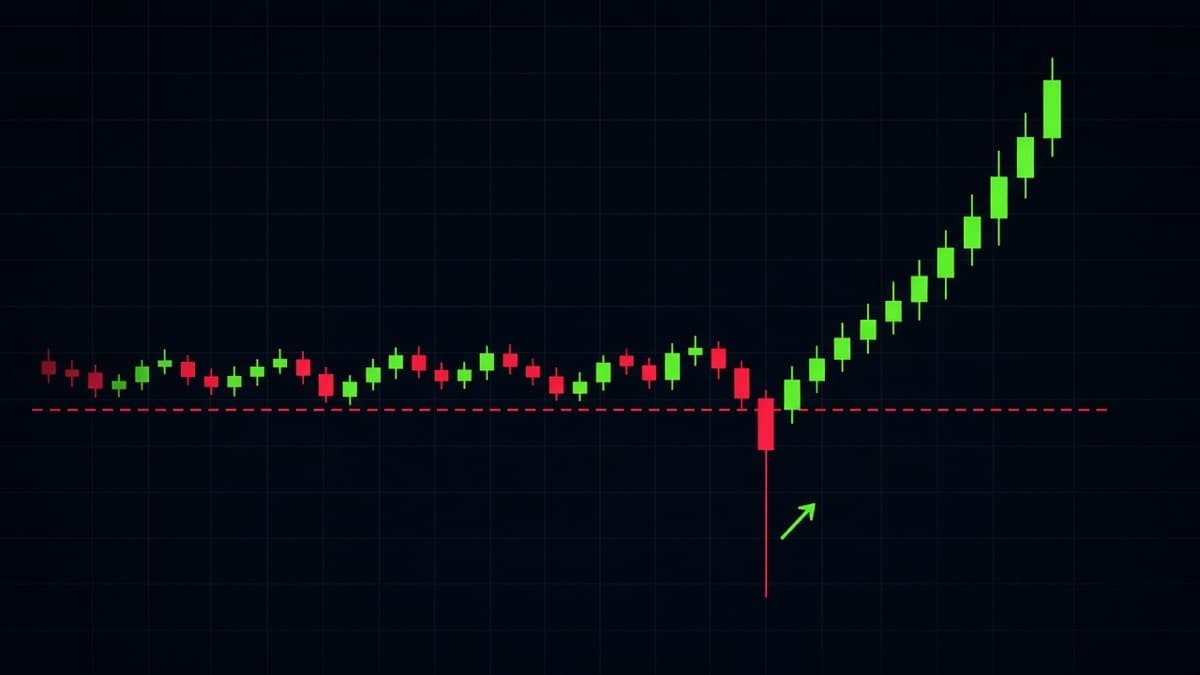
The shape: price sits in a quiet overnight range. The session opens. Price pushes out of the range in one direction, far enough to take the obvious highs or lows sitting there. It fails to hold. Then it reverses and spends the rest of the session moving in the opposite direction.
Why it is worth knowing: the first move out of a range at a session open is the one most likely to catch traders who were waiting for a breakout. If you take that breakout at face value you are positioned against the session.
How to use it without over-fitting:
- Mark the Asia range before London opens. The high and the low. Two lines, nothing else.
- Do not trade the first push out of it. Watch it.
- If price takes one side and closes back inside within the next two or three candles, that is your signal to look the other way. Then wait for displacement in the new direction before entering, using the sequence from liquidity sweeps and stop hunts.
- If price takes one side and keeps going, it was a real break. Do not fight it because you were expecting a judas swing.
That last point matters more than the pattern itself. The judas swing is a description of something that happens often, not a rule about what has to happen. Plenty of sessions open and trend straight away. Trading a reversal because the clock says 07:15 is not analysis.
Power of three
Accumulation, manipulation, distribution. Three phases describing how a session or a daily candle often builds.
Accumulation. Price ranges in a tight band. Not much happens. On a daily candle this is the overnight period. On a session this is the hour before the open.
Manipulation. Price breaks out of the range in one direction and takes the liquidity sitting there. This is the same thing the judas swing describes, just at a different scale.
Distribution. The real move, in the opposite direction from the manipulation leg, covering most of the period's range.
The framing is useful because it tells you what part of the move you are looking at. If price has been ranging all morning and then spikes 12 pips through the range low and comes back, you are probably in the manipulation phase, which means the distribution leg has not started yet. That is a reason to wait rather than to chase.
Where it gets misused: people apply the three phases retrospectively to any chart. After the fact, every move can be split into a quiet bit, a false bit and a real bit. Doing that in hindsight proves nothing. Using it in advance means saying, before the fact, "we have had accumulation and I think this spike is manipulation," and then being wrong sometimes.
The daily candle version, sometimes shortened to AMD, applies the same three phases to a full trading day. The daily open is the reference, price trades one side of it early, then spends the main sessions moving to the other side. It happens often enough to be worth watching and not often enough to be a plan on its own.
Optimal trade entry
Optimal trade entry, usually written OTE, is a retracement band between the 62 percent and 79 percent levels of an impulse leg. The 70.5 percent level sits in the middle and often gets marked as the target line.
How to draw it: take the low and high of the leg you want to trade with. On a bullish leg from 1.0800 to 1.0880, the range is 80 pips. The 62 percent retracement is at 1.08304, the 79 percent is at 1.08168. The band is 1.0817 to 1.0830.
What it is: a Fibonacci retracement band with a different name. There is nothing special about those ratios beyond the fact that they represent a deep pullback.
What it is good for: it stops you buying shallow retracements. A pullback to 38 percent leaves you with a bad entry and a wide invalidation. A pullback to 70 percent gives you a much better price and a much smaller distance to the swing low where you are wrong.
What it is bad for: strong trends do not always retrace that deep. In a fast trend, price often turns at 38 or 50 percent and runs, and you sit there with an unfilled order watching it go. If you only take OTE entries you will miss a lot of the best trends.
A practical way to handle that: use the OTE band as a preferred entry, not as a requirement. If price retraces to 50 percent and there is an order block or a fair value gap sitting right there, take the setup anyway. The zones matter more than the ratio. The way those zones work is in order blocks explained.
Also note where OTE sits relative to the range. A 62 to 79 percent retracement of an up leg puts you in the discount half of that leg, which is the same conclusion the premium and discount idea reaches from a different direction.
Market maker buy and sell models
These are templates for how a full move develops from one end to the other. They are the largest structures in the ICT vocabulary and the most loosely defined.
Market maker sell model
The shape:
- Price consolidates at a low. Quiet, tight range.
- It begins a climb. The climb is usually not clean. It makes higher highs and higher lows and looks like a normal uptrend.
- It reaches an area where old highs sit, and it takes them with a wick.
- It turns over and declines, usually faster than it climbed, finishing below where the climb started.
The reasoning offered is that a large seller needs buyers to sell into, and buyers show up when price is making highs and breaking out. Whether that is what is happening is not something you can confirm. The shape itself is real and recognisable.
Market maker buy model
The mirror. Price consolidates at a high, slides down over several hours or days, takes out old lows with a wick, then rallies hard past where the slide began.
Using them without fooling yourself
The honest problem with these models is that they are easy to see after the fact and hard to use in advance. Almost any completed move can be forced into one of the two shapes.
The parts you can actually act on:
- The sweep near the turn. That is a specific, observable event with a defined invalidation.
- The displacement after it. Also specific.
- The consolidation at the start. You can mark that range in advance.
The parts you cannot act on: deciding mid-climb that you are in a sell model and shorting into strength. That is the expensive version.
Treat the models as a description of context. If price has climbed for six hours into an area of old highs and then wicks through them, the sell model shape tells you to take that sweep seriously. It does not tell you to short before the sweep happens.
Displacement and the entry sequence
Almost every ICT entry model reduces to the same three steps, and if you only take one thing from this article, take this.
One, a liquidity event. Price takes an obvious high or low and closes back inside.
Two, displacement. A fast candle or two in the opposite direction, closing beyond the most recent minor swing. This is the confirmation that the sweep meant something.
Three, the entry. The displacement leg leaves behind a fair value gap, an order block at its base, or both. Enter there, not at the sweep.
Everything with a name (the 2022 model, the silver bullet, the unicorn, whichever version you have seen) is a variation of those three steps with extra conditions bolted on about time of day or which timeframes to use. The core is the same. Learn the core first and the named variations become obvious.
The mechanics of step three are in fair value gap explained.
Other terms you will hear
A short list so the vocabulary stops getting in the way.
Silver bullet. A one hour window inside a killzone where you look for that same sweep and gap sequence. The common versions are the 10:00 to 11:00 and 14:00 to 15:00 New York hours. It is a time filter on an existing setup, not a different setup.
SMT divergence. Comparing two correlated instruments. If EUR/USD makes a new low but GBP/USD does not, that disagreement is read as a sign the low is not real. It is a genuinely useful cross-check and it is easy to test yourself on any correlated pair.
Turtle soup. An older name, from a different lineage, for a false breakout reversal. Same thing as a sweep.
Breaker and mitigation blocks. Order block variations, both covered in order blocks explained.
Balanced price range. An area price crossed fast in both directions, so a bullish and bearish gap overlap. Treated as neutral.
Daily bias. A directional read for the day, usually formed from where price is relative to the previous day's range and the daily open.
IPDA. A term for the ranges price moves between over the last 20, 40 and 60 trading days. In practice, a way of saying look at the recent high and low on the daily chart.
Most of these are worth recognising rather than adopting. The vocabulary grows faster than the number of distinct ideas in it.
ICT ideas and short binary expiries
This is where you have to be selective, because the fit is uneven.
Transfers well: session timing. Knowing the London killzone starts at 07:00 UTC in winter tells you when the 1m chart is worth trading. Outside those windows, a 1m setup on EUR/USD is often fighting a 6 pip range where nothing resolves. If you only trade a two hour window a day, pick the right one.
Transfers well: the sweep and displacement sequence. It resolves fast. A sweep that is going to reverse usually starts reversing within one to three candles, which fits a 1 to 5 minute expiry.
Transfers badly: OTE. A retracement band is a limit order concept. You do not know when price will arrive, and a fixed expiry cannot wait.
Transfers badly: the market maker models. They play out over hours. A 1 minute contract has no relationship to a six hour shape.
Needs care: the judas swing. The pattern happens at a session open, which is exactly when volatility spikes. You can be right about the reversal and still lose a 1 minute contract to a 10 pip whipsaw in the wrong direction. Wait for the sweep candle to close, then take the next one, and pick an expiry that matches the timeframe you read it on. Binary options expiry times explained covers the matching.
Whatever you take from this, the sizing decision is separate and it matters more than which model you use. Start with risk management for binary trading.
Daily bias and the daily open
A daily bias is a direction you commit to before the session starts. Without one you end up taking both sides of every range and paying the spread twice.
The simplest version that works, and it uses nothing exotic:
- Where is price relative to the previous day's range? Above the previous high, below the previous low, or inside it.
- Which side of the previous day's range has not been taken? If yesterday's low was swept and yesterday's high was not, the untouched high is the obvious draw.
- Where is price relative to today's open? Price trading below the daily open all morning, then reclaiming it, is a different day from price never touching it.
- What is the daily candle doing? Making a higher high and a higher low against the previous day means the higher timeframe is still pushing up.
Put those together and you get a sentence: "Price is inside yesterday's range, yesterday's high at 1.0879 is untouched, and the daily is making higher lows, so I am looking for longs into 1.0879 today."
That sentence is your bias. It is allowed to be wrong. What it does is stop you from shorting a 5 pip pullback at 09:00 because a 1m candle looked weak.
When to abandon it: when the daily candle closes against it, or when price takes the level you were targeting and fails there. Not when a single 5m candle goes the wrong way.
SMT divergence in practice
This one is genuinely testable and most people skip it, so it is worth a few paragraphs.
Take two pairs that normally move together. EUR/USD and GBP/USD are the standard example, because both are quoted against the dollar and both usually move the same way when the dollar moves.
Now watch what happens at a low. EUR/USD drops and makes a new low at 1.0804, below its earlier low at 1.0811. At the same moment, GBP/USD drops but stops at 1.2608, which is above its earlier low at 1.2604. One pair made a new low, the other did not.
That disagreement is SMT divergence. The read is that the new low on EUR/USD was not a genuine repricing, because if the dollar had really strengthened, both pairs would have made new lows. Something pair-specific caused the EUR/USD low, and the most common explanation is that it was a sweep.
Other correlated sets that work the same way: USD/CAD against crude oil (inverse), AUD/USD against NZD/USD, and the dollar index against any dollar major (inverse).
How to use it without over-reading:
- Use it as a confirmation on a level you already marked, not as a standalone signal.
- The two pairs need to be genuinely correlated at that moment. Correlations break down around pair-specific news.
- The divergence needs to be at the same time, on the same timeframe. Comparing a 5m low on one pair to a 15m low on the other tells you nothing.
The honest limitation: divergence between two pairs happens constantly at small scales, because the pairs are correlated but not identical. Only pay attention to it at levels that already mattered.
A New York session example
EUR/USD, 12:00 to 15:00 UTC in winter, which is the New York morning killzone.
Preparation, done at 11:50. Previous day high 1.0879, untouched. Previous day low 1.0798, swept during London. London session high 1.0861. The 1h is making higher lows. Bias: long, target the untouched previous day high.
11:50 to 12:20. Price sits between 1.0840 and 1.0852. Quiet. This is the accumulation phase and there is nothing to do.
12:24. Price drops out of that range to 1.0831, wicking below the London pullback low at 1.0836, and the 5m candle closes back at 1.0844. That is the manipulation leg: a sweep of the obvious low sitting under the range, in the wrong direction for the bias.
12:30 to 12:40. Two 5m candles run from 1.0844 to 1.0866, closing above the London high at 1.0861. That is displacement and a break of structure. Those candles leave a fair value gap between 1.0848 and 1.0854.
12:45. Price retraces into the gap and taps 1.0851, the midpoint. That is the entry. Invalidation below 1.0831, the sweep wick.
Target. The untouched previous day high at 1.0879, which is where buy-side liquidity is sitting.
Look at what that sequence used: killzone timing, the accumulation and manipulation shape, a sweep, displacement, and a gap entry. Five ICT ideas in one trade, and none of them required a view about who was buying.
Also look at what could have gone wrong. If the 12:24 drop had kept going and closed below 1.0820, there was no trade. If the displacement had not closed above 1.0861, there was no trade. Most sessions produce no trade at all, and that is the normal outcome rather than a failure.
What to be careful about
A few things worth saying directly.
Do not treat any of this as proven. These are descriptions of chart behaviour. Some of them hold up well under testing on some pairs at some hours. None of them come with a documented hit rate, and anyone quoting one to you made it up.
The institutional narrative is not the setup. You can trade a sweep and a gap without believing anything about who placed the orders. Keep the observable part and be indifferent to the story.
Beware the growing vocabulary. Every few months another named model appears. Almost all of them are the same sweep, displacement and gap sequence with an added condition. Adding names does not add edge.
Time windows are not a filter for quality. Trading only during a killzone means you trade during the volatile hours. It does not mean your setups are better. It means your winners and losers are both bigger.
Do not trade the model before the trigger. The most common way to lose money with ICT concepts is deciding you are in a sell model at 11:00 and shorting into strength for the next two hours. Wait for the liquidity event.
Glossary
| Term | Plain meaning |
|---|---|
| Killzone | A window around a session open where the range usually expands |
| Judas swing | The first move out of the overnight range, when it goes the wrong way |
| Accumulation | Quiet range before a move |
| Manipulation | The false push out of that range |
| Distribution | The real move that follows |
| OTE | The 62 to 79 percent retracement band of an impulse leg |
| Displacement | A fast one-sided move, usually leaving a gap |
| Market maker sell model | Base, climb, sweep of highs, decline past the start |
| Market maker buy model | Top, slide, sweep of lows, rally past the start |
| Silver bullet | A one hour window inside a killzone used as a time filter |
| SMT divergence | Two correlated pairs disagreeing on a new high or low |
| Turtle soup | Older name for a false breakout reversal |
| Daily bias | A directional read for the day from the previous day's range |
| IPDA | Shorthand for the recent 20, 40 and 60 day price ranges |
A session routine you can actually run
If you want to use these ideas rather than collect them, this is a workable daily process. It takes about ten minutes of preparation.
- Before 07:00 UTC. Mark the Asia range high and low on EUR/USD 15m. Mark the previous day high and low. Four lines.
- Mark the higher timeframe trend. Is the 1h making higher highs and higher lows, or the opposite? Write it down. This decides which direction you are allowed to take.
- Mark the range midpoint. You want to buy below it and sell above it.
- 07:00 to 10:00 UTC. Watch. Do not trade the first push out of the Asia range. Wait for one of your four lines to be taken with a wick that closes back inside.
- After the sweep, wait for displacement. A 5m candle that closes beyond the last minor swing in the new direction.
- Enter on the gap or the order block that displacement left. Invalidation past the sweep wick.
- Stop at 10:00 UTC. If nothing set up, nothing set up. Come back for 12:00.
That routine uses killzone timing, the judas swing, the sweep and displacement sequence, and range position, without requiring you to believe anything about who is on the other side of the trade.
How REDBERRY fits
For context on the desk: REDBERRY reads live market data rather than asking you to mark sessions and levels by hand.
Live pairs use the TradingView API for realtime price and chart structure, and the inbuilt strategies work from that to predict the next move. Live covers 17 FX pairs and always generates on a 1 minute view. OTC pairs use private Quotex API access for a live OTC price feed, with the same inbuilt strategies applied, across the timeframes each platform offers.
Signals are not 100 percent accurate. Nothing that forecasts the next candle is. Knowing the session structure yourself still matters, because it tells you when a signal is arriving during the hours the pair actually moves and when it is arriving into a dead 6 pip range. REDBERRY is a non-profit informational desk, not a broker, and the trade decision is always yours. How the two feeds work is in how REDBERRY generates Live and OTC signals.
What to test first
If you are starting from zero, test the pieces in this order, one at a time, on one pair.
First, session timing. For two weeks, record the range of EUR/USD in each four hour block. You will see the expansion hours immediately, and you will know your own numbers rather than someone else's.
Second, the sweep and displacement sequence. Mark the Asia high and low every day and note what happens when each is taken. Does the sweep produce a reversal, or does price keep going?
Third, retracement depth. For every clean impulse leg, note how deep the pullback went before continuation: 38, 50, 62, 70, 79 percent, or through. After thirty legs you will know whether the OTE band is where your pair actually turns.
Three tests, six weeks, one pair. That will tell you more about which of these concepts is worth your time than reading another twenty articles about them.
Questions people ask
What does ICT stand for in trading?
Inner Circle Trader, the name Michael J. Huddleston publishes under. The ICT label is now used loosely for a whole body of terminology: killzones, judas swing, optimal trade entry, power of three, market maker models and much of the order block and fair value gap language that overlaps with smart money concepts.
What time are the ICT killzones in UTC?
The commonly quoted windows are roughly 07:00 to 10:00 UTC for the London killzone and 12:00 to 15:00 UTC for the New York morning killzone during northern hemisphere winter. Both shift an hour earlier when daylight saving is in effect, because the windows are defined in New York local time.
What is a judas swing?
The first move after a session opens that goes the wrong way. Price pushes out of the overnight range in one direction, takes the obvious liquidity there, fails, and then trends the other way for the rest of the session. It is a description of a common pattern, not something that happens every day.
What is optimal trade entry?
A retracement band between the 62 and 79 percent levels of an impulse leg, with 70.5 percent often marked in the middle. The idea is to enter on a deep pullback rather than a shallow one. It is a Fibonacci band with a different name and no special properties beyond being a deep retracement.
What is the power of three?
A three part description of how a session or a day often develops: accumulation, where price ranges quietly, manipulation, where it pushes out of the range in the wrong direction, and distribution, where the real move happens. It is a template for what to watch, not a schedule.
Do ICT concepts work on one minute binary expiries?
The timing ideas help most. Knowing that the London and New York windows produce the day's expansion tells you when the 1m chart is worth trading and when it is noise. The entry models themselves need room to work, so a fixed one minute expiry can turn a correct read into a loss purely on timing.
Nothing here is financial advice. Signals and setups can be wrong, so only risk money whose loss will not change your life.