Home

Trading guides

Core trading guides: how price moves, how to read a chart, how to size risk, and how to keep a losing week from turning into a losing month.

Diagram of how REDBERRY generates signals, from the TradingView and OTC price feeds through inbuilt strategies to an UP or DOWN call

Redberry18 Sept 202614 min read

How REDBERRY Generates Live and OTC Signals

The data path behind a REDBERRY signal: TradingView for Live pairs, private Quotex API for OTC, then inbuilt strategies and an expiry window.

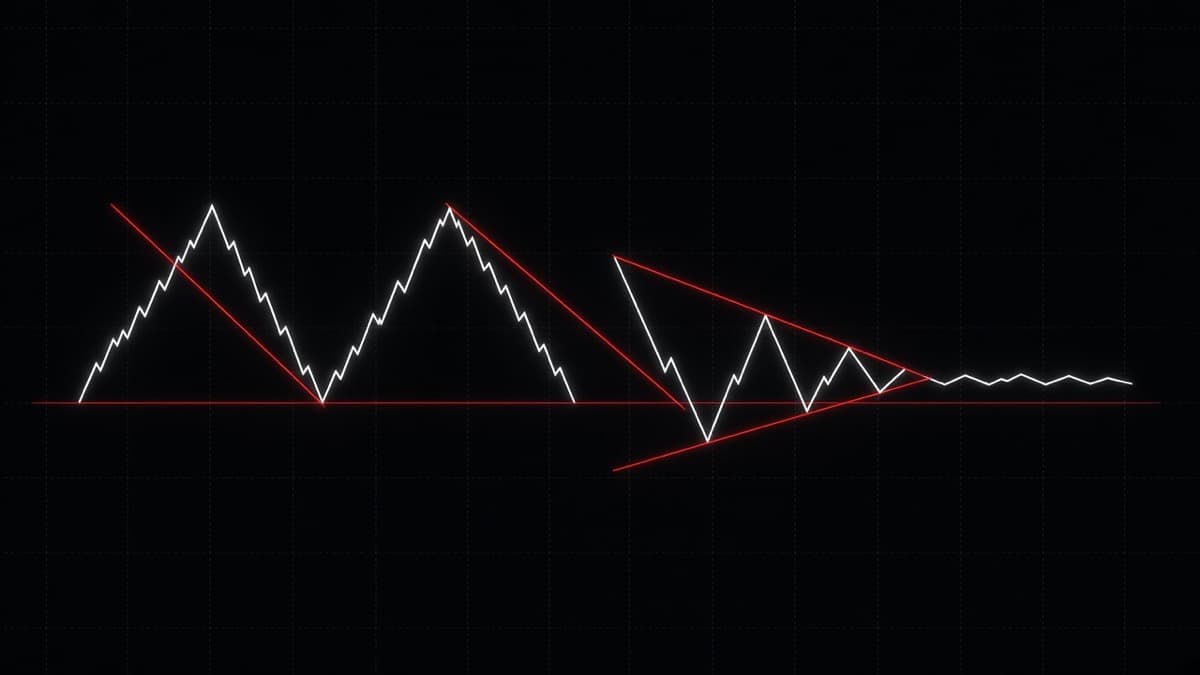
Chart patterns diagram showing a double top, a head and shoulders, an ascending triangle and a bull flag with necklines, trendlines and breakout arrows

Chart patterns18 Sept 202624 min read

Chart Patterns: A Complete Guide for Traders

Chart patterns explained the way traders use them: continuation versus reversal, where the neckline sits, measured targets, and how breakouts fail.

Smart money concepts chart showing market structure, an order block zone, a fair value gap and a liquidity sweep

Smart money concepts18 Sept 202622 min read

Smart Money Concepts: A Complete Trading Guide

Smart money concepts explained without the mystique: market structure, break of structure, order blocks, fair value gaps, liquidity and premium versus discount.

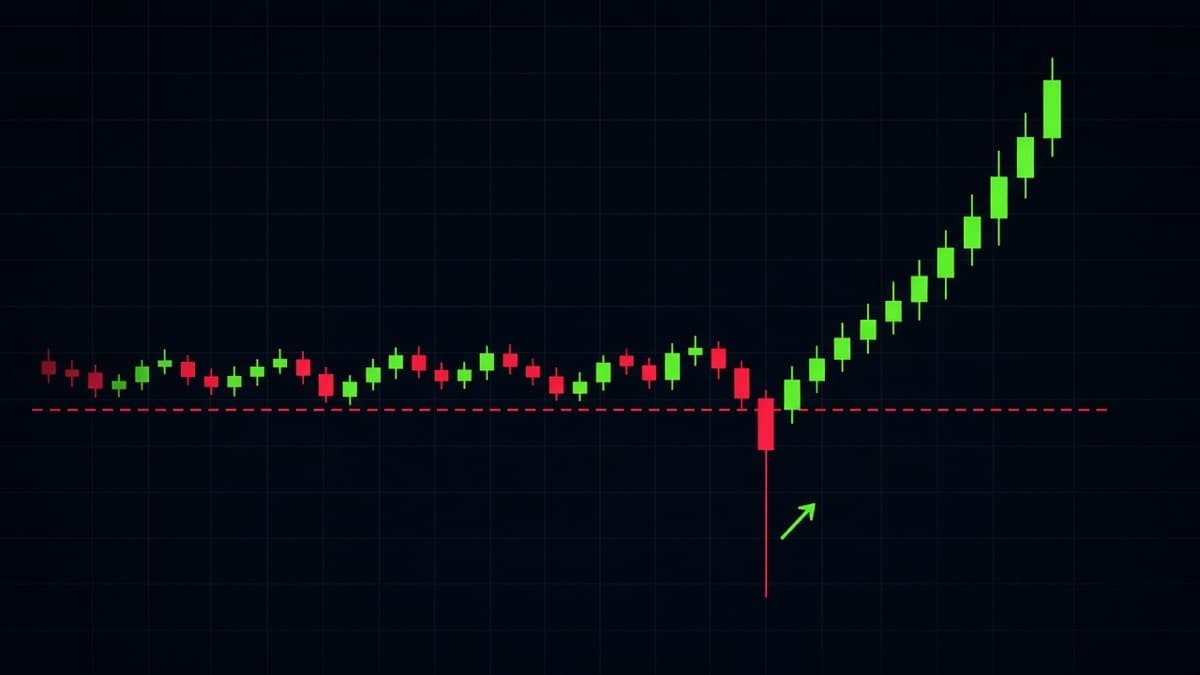
Liquidity sweep on a candlestick chart showing a wick spiking below equal lows before price reverses upward

Smart money concepts18 Sept 202617 min read

Liquidity Sweeps and Stop Hunts Explained

Liquidity sweeps explained: where resting orders sit, how to read the sweep wick, equal highs and lows, and how to tell a sweep from a real break of a level.