Common Binary Trading Mistakes and How to Fix Them
Binary trading mistakes with the chart situation that causes each one, from mid-candle entries and one-touch levels to doubling after a loss, and the fix.
Almost every losing week comes from a short list of repeatable errors, and each one has a chart situation that triggers it. Knowing the rule is not the hard part. Recognising the chart that is about to make you break the rule is the hard part, so this list is organised around the chart rather than around the advice.
Work through it with your own journal open. If you have fifty logged trades you will recognise three or four of these as yours, and those are the only ones worth working on.
Entering halfway through a candle on a short expiry
The chart situation. The last four candles have a range of roughly 1.2 points each. The current candle has already run 2.0 points and looks strong. You take UP with a 1 minute expiry, 40 seconds into that candle.
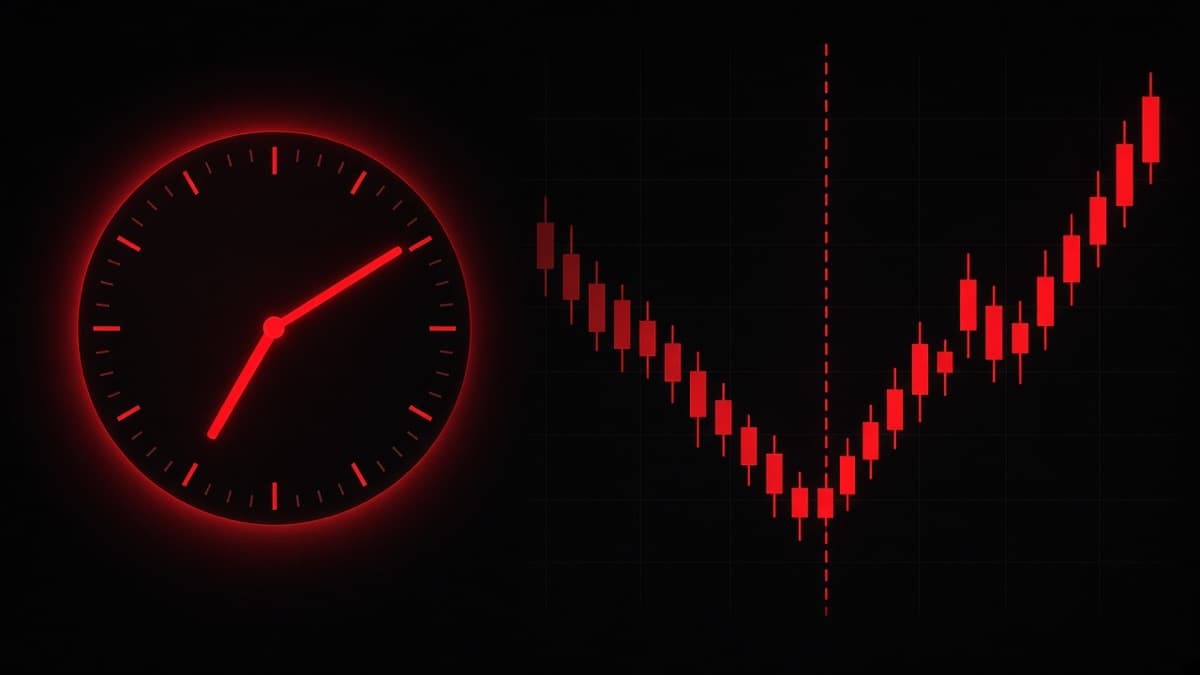
Two things are working against you and neither is about direction. The candle has already spent more than its usual range, so the easy part of the move has happened. And your 1 minute clock does not settle at the close of that candle, it settles 40 seconds into the next one, which means you are being judged on a moment you never analysed.
The fix. Enter in the first seconds of a new candle when your read is about a candle close. If you are late, either skip it or use an expiry long enough that a 40 second offset does not decide the trade, which usually means 5 minutes or more. If your platform offers an expiry that settles at a fixed clock time rather than a fixed duration, that removes the offset completely. The full argument for matching clocks to setups is in binary options expiry times explained.
Buying the close of the candle that already moved
The chart situation. Price has been stuck in a small range. One candle breaks out hard. It feels obvious, it feels urgent, and you take UP at its close.
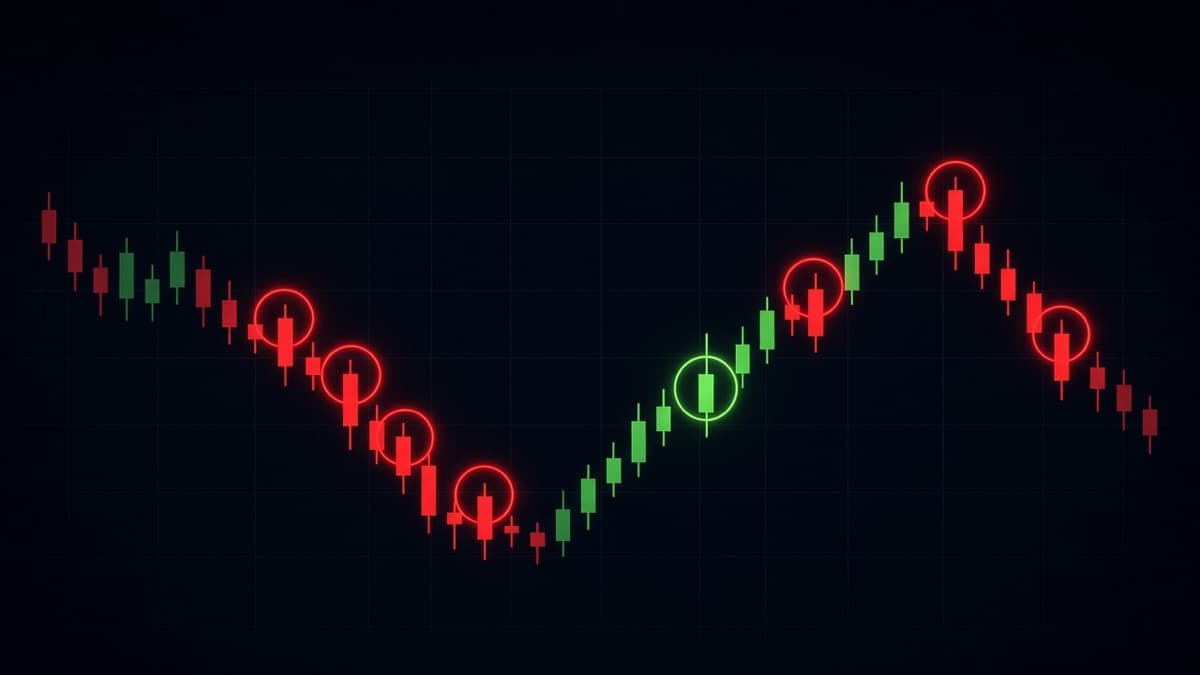
You are buying from the people who were positioned before the break. The move just happened, the participants who wanted in are in, and the most likely next event on a short clock is a pullback into the level that broke. That is exactly what the chart above shows.
The fix. Trade the retest, not the break. A real break usually comes back to the level it broke, and that entry has a defined invalidation: if price closes back inside the range, the idea is wrong. The structure behind that behaviour is in chart patterns complete guide. If the retest never comes, you missed one setup out of the dozens that pair will give you this week.
Buying a downtrend because it looks cheap
The chart situation. Price has dropped hard for three candles. One small green candle prints. It has to bounce, so you take UP.
One green candle in a downtrend is not a reversal, it is a pause in a downtrend. Nothing on that chart changed: the highs are still lower, the lows are still lower, and sellers are still in control. You are trading a feeling about fairness in a market that does not have one.
The fix. Require a structural reason before you trade against a trend. That means a break of the last swing high, or a failure to make a new low followed by a real reversal candle. Bullish and bearish engulfing covers the candle that actually qualifies, and break of structure style reading covers the level that has to give way first. Until one of those appears, the correct trade in a downtrend is DOWN or nothing.
Trading with the trend at the exact moment it ends
The chart situation. The opposite error, and it catches more experienced traders. Price has made four higher highs, so you keep taking UP. Then price cuts through the last higher low, which is the first evidence that the buyers running this move have stopped. You take UP once more on the bounce because the trend has been paying all morning.
The bounce after that break is usually a lower high. Your trend read was correct for an hour and became wrong at a specific, visible moment, and that moment is on the chart.
The fix. Mark the last higher low while you are in the trend, and write down that a close below it retires the trend idea for the session. That is one line of preparation and it converts a vague trend feeling into a rule with an off switch. The full structural language for this is in smart money concepts guide.
Drawing a level from a single touch
The chart situation. Price spiked to 1.0865 an hour ago. You draw a line there. Price comes back and you take DOWN at that line because it is resistance. Price goes straight through without hesitating.
One touch is a data point, not a level. A level earns the name when price has reacted to it more than once, ideally from both directions. If the only evidence is a single wick, there is nothing to trade.
The fix. Count the touches before you draw. Two touches with visible reactions is a minimum, three is better, and the best levels are the ones that acted as resistance and later held as support. Double top and double bottom is that idea made into a pattern. Also drop the habit of drawing a level for every wick on the screen, because a chart with nine lines on it means every entry has a justification available.
Trading straight into the level where the stops are
The chart situation. Two lows at 1.2635, clearly visible, sitting there all morning. Price approaches them again and you take DOWN, because a break of that support means continuation.
Everyone can see those lows, which is the problem. Obvious levels are where stop orders pile up, and a poke through them is one of the most common things a market does before moving the other way. Your DOWN trade needed a break. What printed was a long wick through the level and a close back above it.
The fix. Let the level get taken before you trade it. Wait for the spike, then trade the reaction after the close back inside. That entry is later in price terms and much earlier in information terms, because you now know which side got trapped. Liquidity sweeps and stop hunts goes through the mechanics, and the practical version is a single rule: no entries in the last few pips before an obvious equal high or equal low.
Waiting for the indicator to confirm
The chart situation. Your average or oscillator turns up, so you take UP, and price immediately rolls over.
Anything smoothed is built from candles that have already closed. A 14 period average on a 1 minute chart is a summary of the last 14 minutes. By the time it confirms, the move it is confirming has mostly happened, which is fine for a slow clock and fatal on a fast one.
The fix. Use indicators to filter, not to trigger. A slower average can tell you which side of the market you want to be on. The trigger should be price itself: a level, a rejection candle, a break and retest. If you take nothing else from this list, notice that every fast input is a price input.
Doubling after a loss
The chart situation. Not a chart at all, which is the problem. The trigger is the previous result rather than anything on the screen.
The arithmetic is unkind and worth knowing exactly. At an 85 percent payout on a $1 base, doubling stops covering the sequence on the fourth trade of a losing run: you have lost $7, you stake $8, you win, and you are still 20 cents behind. To genuinely recover you have to multiply by about 2.18 each step, which means six losses in a row have taken $89.49 of a $100 account and the seventh step needs a $106 stake. A six loss run arrives roughly once in every 120 trades at a 55 percent win rate.
The fix. One step of MTG at most, sized so that the base plus the step fits inside your per signal risk budget. On a $500 account at 2 percent, that is $10 total, so a $3.33 base and a $6.67 step. There is no third trade. The full working, including why no staking plan can change your break-even win rate, is in risk management for binary trading.
Letting the stake drift after a win
The chart situation. Four wins in a row on EUR/USD in the London session. The reads have been clean. The stake was $5, and now it is $12 because the account is up and the next setup looks like the others.
The money you won ten minutes ago does not feel like your money yet, so risking it feels cheap. Then the losing run arrives, as it does, and it arrives at the new size. Two losses at $12 remove four wins at $5.
The fix. Write the cash stake on paper before the session and do not recalculate it during the session. Add a profit rule that mirrors your loss rule: a trade count cap, or one more trade after your best result of the day. The behavioural side of this is in trading psychology and discipline.
Picking the expiry by mood
The chart situation. You read a rejection on the 5 minute chart, then take a 30 second expiry because you want to know now.
Your read was about a move that needs several 5 minute candles. Your settlement happens inside noise. When it loses, the journal records a failed setup, and the setup was never tested.
The fix. Pick one expiry per session and only read setups on the timeframe that matches it. A working rule is that the expiry should cover two to five candles of the timeframe the signal came from. Log the expiry on every row so that when you split your win rate by clock, the answer is in your own data.
Ignoring the payout number on the screen
The chart situation. You take the same setup you always take, at a payout that has dropped for this pair or this expiry, and you do not notice.
Break-even win rate is 1 / (1 + p), where p is the payout as a decimal. At 85 percent you need 54.1 percent winners. At 70 percent you need 58.8 percent. That is nearly five extra percentage points of win rate for taking the same trade at a worse price, and five points of win rate is more skill than most traders gain in a year.
The fix. Read the payout before every trade and do the division. If a pair is paying badly, trade a different pair or a different expiry. Treating payout as scenery is the most avoidable error on this list, and the mechanics are explained in what is binary trading.
Carrying levels between feeds
The chart situation. You marked 1.0840 on EUR/USD during the London session on Friday. On Sunday you open EUR/USD OTC and trade the same line.
They are not the same instrument. OTC pairs are quoted by the platform from its own feed, which is exactly why they stay open when the exchange traded market is closed. The structure on an OTC chart is readable and worth trading, and it does not inherit your levels from the other feed.
The fix. Keep two sets of levels, marked separately, and check the pair name. Quotex writes it as EUR/USD (OTC). If the name contains OTC, your weekday levels do not apply. Platform behaviour is covered in the Quotex trading guide.
Trading the session lull
The chart situation. It is the gap between the London close and the New York open. EUR/USD is moving inside a three pip box. Every 1 minute candle has a small body and wicks on both sides. You take a trade because you have been watching for forty minutes.
The payout does not fall when the market goes quiet, but your edge does. A coin flip at an 85 percent payout costs 7.5 percent of your stake per trade, calculated as 0.5 times 0.85 minus 0.5 times 1.00. Over 100 trades at $5 that is an expected loss of $37.50 with no bad luck required.
The fix. Trade a session, not a day, and cap the trade count. Which hours move which pairs is in forex pairs and trading sessions. If the last twenty candles show a normal range smaller than the move your setup needs, there is no trade, and shortening the clock does not create one.
Taking the next trade because the last one lost
The chart situation. Your DOWN trade on GBP/USD just lost. Price is ticking up. Thirty seconds later you are in another DOWN, bigger, at a worse price, with no new reason on the chart.
The reason for that trade was the previous trade. That is the entire definition of the error, and the entry price is almost always the worst of the sequence, because revenge trades are taken late into whatever just hurt you.
The fix. A five minute timer after every loss, away from the screen, and a hard cap of three losses for the day. The stake stays as the cash number you wrote down before the session. If you cannot state the reason for a trade in five words before clicking, it does not happen. None of those require you to feel calm, which is the reason they work.
Watching six pairs at once
The chart situation. Four tabs open, two OTC pairs and two Live pairs, plus a search box full of others. Something is always doing something, so you are always about to click.
More screens do not create more edge, they create more triggers. You cannot know what normal looks like on six instruments at once, and knowing what normal looks like is the whole basis of deciding whether a move is big enough for your clock.
The fix. Two pairs, one session, for a month. Learn the usual range of a candle on both. When your journal shows fifty trades on two pairs, you will know more about them than most traders know about any instrument, and the decision to add a third becomes evidence based rather than restless.
Changing the strategy every week
The chart situation. A losing week ends, so the engulfing setup gets dropped for an order block approach, which lasts nine trades before it becomes something else.
Nine trades tells you nothing. At a 55 percent win rate, losing five of nine happens constantly, and a genuinely good method will produce losing runs that look exactly like a broken method. Switching on that evidence means you will spend a year never testing anything.
The fix. Fifty trades per method, minimum, logged, before any verdict. Judge it against 1 / (1 + p) rather than against how the week felt. If you want to learn a second approach, paper trade it in a separate log while the first one keeps running with real size.
Not writing anything down
The chart situation. There is no chart. There is a trader who has been losing for four months and cannot tell you their win rate by expiry, by pair or by hour.
Without a log there is nothing to fix. Every conclusion is a memory, memories favour the dramatic trades, and the dramatic trades are not where the money leaks. The leak is usually something dull and consistent, like a 1 minute clock or a bad hour.
The fix. Nine columns: date and time, pair, expiry, direction, stake, the reason in five words, result, payout percent, and a confidence score from 1 to 3. Fill the row before the trade settles. At fifty rows, sort by each column and count. The answer is usually obvious and usually not the one you expected.
Expecting a signal to remove all of this
The chart situation. The desk shows UP on a pair, you take it at three times your normal size because it came from the desk, and it loses.
Signals are not 100 percent accurate. Nobody has a guaranteed read on the next candle. What a desk does is remove the endless question of what to take: REDBERRY reads the TradingView API for realtime price and chart structure on the 17 Live FX pairs and calls the next minute, and on OTC it uses private Quotex API access for a live price feed with the same inbuilt strategies. It does not hold your funds, it does not place your trades, and it cannot size your position.
The fix. Treat the signal as the entry decision and keep every other rule intact. That is why the desk rules are what they are: Live account rather than broker demo, 1 to 2 percent risk per signal, at most one step of MTG. Everything after the signal appears is still your job, and most of the errors on this list happen in that window. REDBERRY AI bot explained covers what the desk does and does not do.
Stacking three trades on one idea
The chart situation. A setup looks excellent, so you take it on EUR/USD, then again on EUR/GBP, then again on EUR/JPY, all UP, all at once, all 2 percent.
That is not three trades, it is one trade at 6 percent. Those pairs share the euro, so they will often settle the same way, and you have quietly broken your risk rule while feeling diversified. The same thing happens when people take the same pair at three different expiries on one read.
The fix. Count exposure by idea, not by ticket. If two positions win or lose together most of the time, they are one position and the total has to fit inside your per trade budget. Practically that means one trade per idea, and if you want more size on your best reads, take it from the budget rather than adding it on top. The sizing framework is in risk management for binary trading.
How to work through this list
Do not fix twelve things. Take the journal, count which of these shows up most often in your last fifty trades, and write one rule for it. Trade that rule for two weeks without changing anything else, then count again.
The reason for going one at a time is measurement. If you change your expiry, your stake, your pairs and your session in the same week, and the results improve, you have learned nothing you can keep. If you change one thing and your win rate on the same setups moves four points, you have found something real.
One more honest note. Some of these errors will come back, especially the late entries and the size drift, because they are driven by how a chart feels in the moment rather than by ignorance. That is normal, and it is the argument for keeping the mechanical brakes: the cash stake on paper, the three loss stop, the one step MTG limit. If something about the desk itself is unclear while you are building those rules, ask through the contact page rather than guessing.
Questions people ask
What is the most common binary trading mistake?
Mismatching the expiry to the setup. A read taken from 5 minute candles and settled in 60 seconds is a different bet from the one you analysed, and it loses for reasons that have nothing to do with your analysis. Sizing errors destroy accounts faster, but expiry errors are the ones that quietly ruin an otherwise decent win rate.
Why does price reverse right after I enter?
Usually because you entered late. If the move is already four or five candles old, the next likely event is a pullback, so entering at the close of the last big candle puts your settlement inside it. It can also be a sweep of the obvious level you were trading into. Both are fixed by entering earlier at a level or waiting for the retest.
Should I use indicators for 1 minute trades?
Be careful with anything smoothed. A moving average or an oscillator built from the last 14 candles is telling you about the past 14 minutes, and it turns after the move. On a 1 minute expiry that lag is the whole trade. Price, levels and the shape of the current candle are faster inputs, and speed is what a short clock needs.
Is trading OTC pairs a mistake?
No, but treating them as the same instrument is. OTC is quoted by the platform from its own feed, which is why it stays open at the weekend. The structure is readable, but a level from Friday's exchange traded EUR/USD has no claim on EUR/USD OTC on Sunday. Mark your levels separately for each feed.
How many of these should I fix at once?
One. Pick the mistake your own journal shows most often, write a single rule for it, and trade it for two weeks before touching anything else. Changing five things at once means you cannot tell which change helped, and it usually means none of them survive a bad Tuesday.
Does using a signal desk remove these mistakes?
It removes the question of what to take, not the mistakes around it. REDBERRY reads a live feed and applies inbuilt strategies, and the signals are not 100 percent accurate. You still pick the size, the clock on OTC, and whether to stop after three losses. Most of the errors on this list happen after the signal appears.
Nothing here is financial advice. Signals and setups can be wrong, so only risk money whose loss will not change your life.