Smart Money Concepts: A Complete Trading Guide
Smart money concepts explained without the mystique: market structure, break of structure, order blocks, fair value gaps, liquidity and premium versus discount.

Smart money concepts is a vocabulary for reading price structure. That is what it is, and that is enough to make it useful. Order block, fair value gap, liquidity sweep, break of structure: these are names for things traders have described for decades under other labels like supply and demand, imbalance, stop run and trend break. The vocabulary is worth learning because it forces you to be precise about where you enter and why. It does not give you a hidden order flow feed. Nobody looking at a retail chart can see who is buying.
This guide covers the whole framework in the order you should learn it: structure first, then liquidity, then the zones, then where in the range you are. Each section links out to a longer article on that one idea.
What are smart money concepts?
Smart money concepts, usually shortened to SMC, is a way of reading a chart built around four questions:
- Which way is structure pointing right now?
- Where are the obvious places orders are sitting?
- Which specific candle or price band did the last real move come from?
- Are you buying in the cheap half of the range or the expensive half?
Answer those four and you have a trade idea with a defined entry, a defined invalidation and a reason. That is the whole benefit. The framework replaces "it looks like it is going up" with "structure broke up at 1.0842, price swept the low at 1.0811, and I am buying the gap between 1.0818 and 1.0824 with invalidation below 1.0811."
The name is the weakest part of it. "Smart money" implies you are following institutional orders. You are not. You are reading the footprint that large orders leave in price, which is a much weaker claim, and it is still a useful one. Price does behave differently around areas where a lot of orders changed hands, and it does tend to reach round numbers and obvious highs before turning. You can trade that without believing anyone is targeting you personally.
A working definition: SMC is a naming system for supply, demand and stop placement. Use the names to be precise. Do not use them to feel like you have inside information.
Market structure: the part you have to get right
Everything else in SMC sits on top of market structure. If you mark structure wrong, your order blocks will be in the wrong place and your gaps will point the wrong way. This is the part to practise until it is boring.
Structure is just the sequence of swing highs and swing lows.
What an uptrend looks like
An uptrend makes higher highs and higher lows. Price pushes up, pulls back without going below the previous pullback low, then pushes up past the previous high. Repeat.
The important line in an uptrend is not the high. It is the last higher low. That low is the level that says the trend is still intact. While price stays above it, you keep looking for longs. The moment price closes below it, something changed.
What a downtrend looks like
A downtrend is the mirror: lower highs and lower lows. Each bounce fails below the previous bounce, each new low goes further than the last.
In a downtrend the level to watch is the last lower high. While price stays under it, keep looking for shorts.
Which swing points count
This is where most people get sloppy. Not every wiggle is a swing point. A usable definition that works on any timeframe:
- A swing high is a candle whose high is higher than the two candles either side of it.
- A swing low is a candle whose low is lower than the two candles either side of it.
That is a mechanical rule and it is deliberately dumb. Use it first. Once your chart is covered in marked swings, remove the ones that did not produce a real move. On EUR/USD 15m, a swing that led to a 6 pip bounce is noise. A swing that led to a 30 pip leg is structure.
Two more rules that save a lot of arguing with yourself:
- Use candle closes for structure breaks, not wicks. A wick through the level is a different event, and it has its own name, which we get to below.
- Mark structure on one timeframe at a time. Do not mix a 1h swing low with a 1m swing high on the same drawing.
Break of structure versus change of character
These two get confused constantly, and the confusion matters because they mean opposite things.
Break of structure
A break of structure, written BOS, is a continuation signal. In an uptrend, price closes above the previous high. That is a bullish BOS. It tells you the trend you already identified is still running.
BOS does not start anything. It confirms. If you were already long, a BOS is the market agreeing with you.
Change of character
A change of character, written CHoCH, is the first break against the existing trend. In an uptrend, the CHoCH is the close below the last higher low. It is the first structural evidence that buyers stopped defending.
The sequence to look for after a bullish CHoCH is: close above the last lower high, then a pullback that makes a higher low, then a push to a higher high. Only when you have the higher low and the higher high do you have an actual uptrend. The CHoCH by itself is a warning, not a trend.
The mistake most people make with CHoCH
They treat every CHoCH as a reversal signal and trade it immediately. In a strong trend you will get several CHoCH prints on the lower timeframes that are just deep pullbacks. Filter them:
- A CHoCH that happens after price has swept liquidity (more on that below) is worth more than one that happens in the middle of a range.
- A CHoCH made by a single fast candle that closes near its high or low is worth more than one made by three slow overlapping candles.
- A CHoCH against a clean higher timeframe trend is usually a pullback, not a reversal. On EUR/USD, a 1m CHoCH down while the 15m is making higher highs is very often just the start of a retracement that ends in a long.
If you want the same idea in classical language, a change of character is roughly what a trendline break or the neckline break in a double top or double bottom is telling you. Same event, different label.
Liquidity: why price goes where it goes
Liquidity, in this framework, means resting orders. Every stop loss is an order waiting to be filled. Every breakout order is an order waiting to be filled. Those orders are not spread evenly across the chart. They pile up in predictable places.
Where they pile up:
- Just above an obvious swing high. Short sellers put stops there. Breakout buyers put entries there.
- Just below an obvious swing low. Long holders put stops there. Breakout sellers put entries there.
- Just beyond equal highs or equal lows, where two or three swings finished at almost the same price.
- Just under a rising trendline that everybody has drawn the same way.
- Around round numbers. On EUR/USD, 1.0800 and 1.0850 hold more orders than 1.0837.
- Around the previous day's high and low, and the Asia session high and low.
What the liquidity story actually claims
Be careful here, because this is where SMC teaching goes furthest past what anyone can demonstrate.
What is observable: price frequently reaches these obvious levels, trades slightly past them, and then reverses. You can see that on any chart on any pair.
What is a reasonable explanation: a cluster of resting orders at one price is a place where a large buyer or seller can get filled without moving the market as much. If you need to buy size, you buy where sellers are being forced out. That is a structural argument about where liquidity is available, and it does not require anybody to be looking at your account.
What is not established: that banks or brokers identify retail stop losses and deliberately run them. On an exchange-traded instrument nobody can see your stop. On some over-the-counter products the counterparty has more visibility, and that is a fair thing to be aware of, but it is still not proof of targeted hunting. Trade the behaviour, not the story.
The sweep
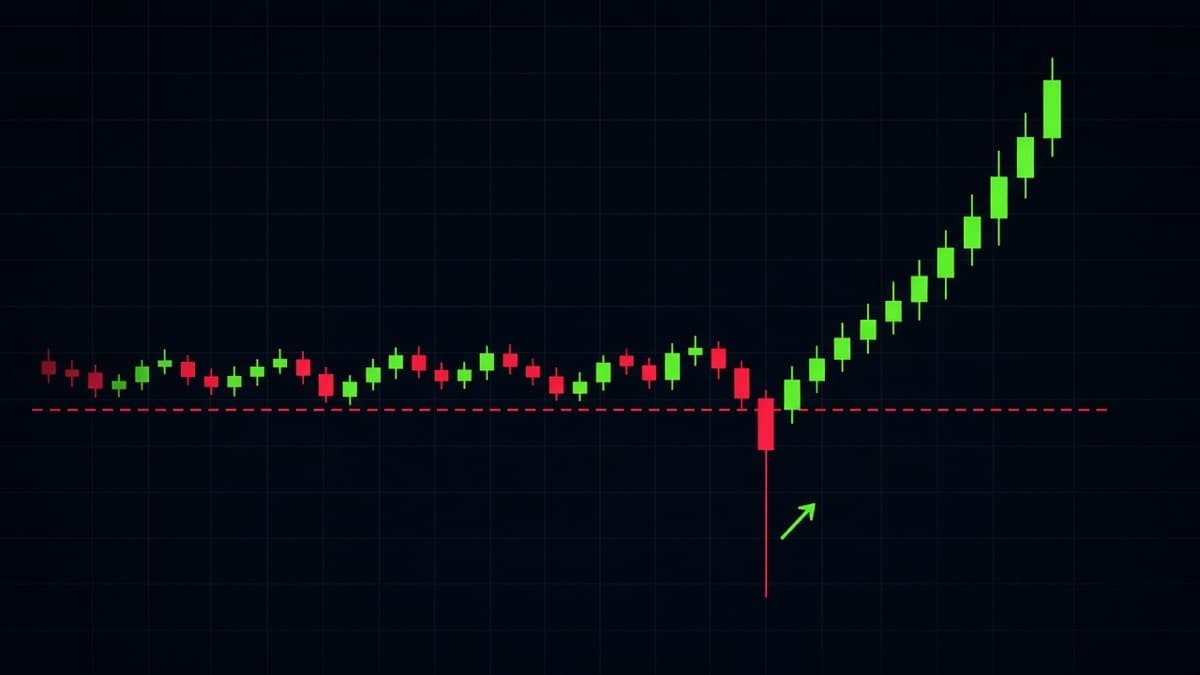
A sweep is the event where price pushes past one of these levels and immediately comes back. On a candle chart it shows up as a wick.
The sweep is the single most useful idea in SMC for short timeframes, because it produces a clear invalidation point. If price swept the low at 1.0811 and you are long, you are wrong below 1.0811. There is no ambiguity. The full treatment is in liquidity sweeps and stop hunts.
Inducement: the move that pulls you in first
Inducement is the small obvious setup that sits in front of the real one. It is worth knowing because it explains a specific kind of loss that feels very unfair when it happens.
Picture EUR/USD 5m in an uptrend. There is a clean pullback low at 1.0828 that everyone can see. Below it, at 1.0811, sits the actual higher low that defines the trend, and below that is the order block you have been waiting for. Price drifts down, breaks 1.0828, and a lot of traders read that as a small change of character and go short. Price then drops another 17 pips into the order block, turns, and runs up for 50.
The 1.0828 low was inducement. It gave price something to take on the way to the real level, and it gave early sellers a reason to be positioned exactly wrong.
How to avoid being the inducement:
- Before you take a setup, look below it (for longs) or above it (for shorts) and ask what the next obvious level is. If there is a clean pool of liquidity 15 pips further on, expect price to go there first.
- Prefer the setup that sits beyond the obvious level, not the one in front of it.
- If your entry has a tidy little swing low sitting right underneath it, your invalidation should go below that swing low, not above it.
Inducement is not a separate pattern. It is the same liquidity logic applied one step earlier, and once you start looking for it you see it on most clean trends.
Order blocks and supply and demand zones
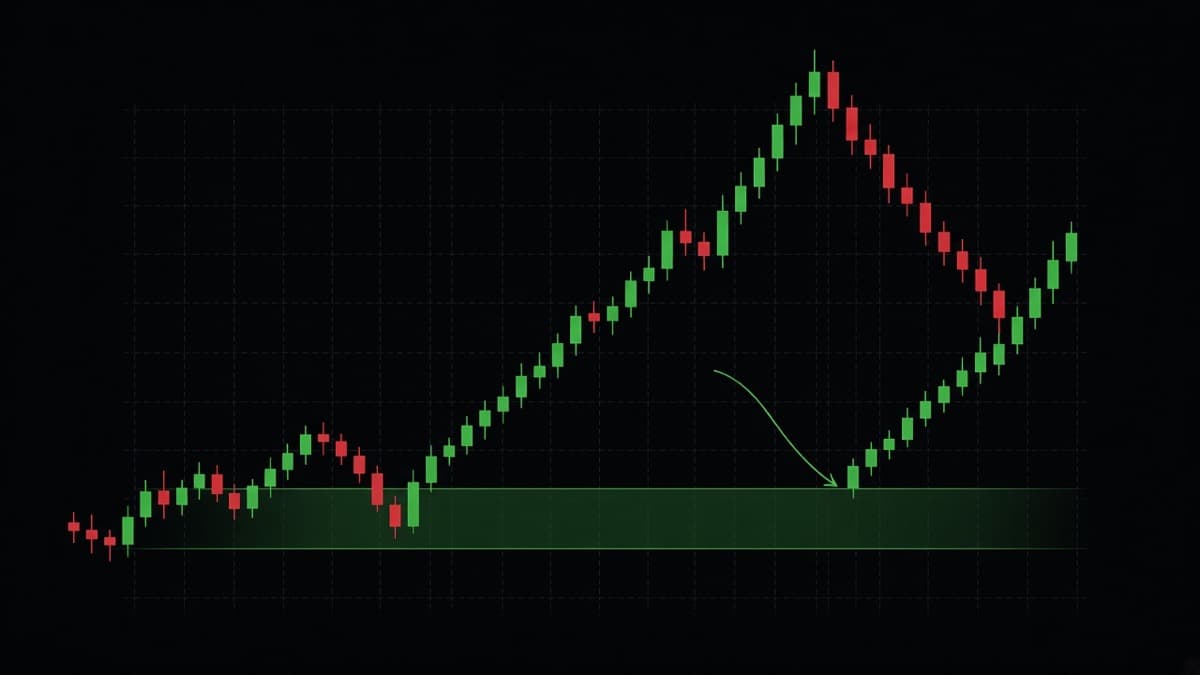
An order block is the last opposing candle before a move that breaks structure. That is the definition to memorise.
For a bullish order block: find a move up that broke a swing high. Walk back to the candle immediately before that move started. If it is a down candle, that candle is the bullish order block. Mark its high and low.
For a bearish order block: find a move down that broke a swing low. The last up candle before that move started is the bearish order block.
Why the last opposing candle
The logic is straightforward. If price was drifting down and then suddenly ran 40 pips up through a swing high, something happened in that area. Whatever it was, the last down candle is the closest thing you have to a marker for where it happened. When price comes back to that price band, the argument is that unfilled interest is still sitting there.
That is an argument, not a fact. Plenty of order blocks get ignored. The reason to use them anyway is not that they are magic, it is that they give you a small, specific zone instead of a vague "around here somewhere." A 6 pip zone with a defined invalidation is a better trade structure than a 30 pip guess, even if both are wrong half the time.
Supply and demand versus order blocks
They are close relatives. A demand zone in classical supply and demand teaching is the base a rally started from, usually a small cluster of candles. An order block is the same idea narrowed down to one candle. If you already trade supply and demand, you do not have to relearn much. You are just being stricter about where the zone starts and ends.
Full detail, including how to refine a zone down to the body and when to use the wick, is in order blocks explained.
Breaker blocks and mitigation blocks
Two variations worth knowing now, both covered properly in the order block article.
A breaker block is a zone that failed and then flipped. Price made a high, the supply at that high got broken through after a low below was swept, and now that old supply zone acts as support. It is the SMC version of the old rule that broken resistance becomes support.
A mitigation block is an order block taken from a swing point that was never swept. No stops were taken at that low, price just turned. The zone is the last down candle at that untouched low.
The practical difference: a breaker has liquidity behind it (the sweep already happened), a mitigation block does not. Many traders rate breakers higher for that reason. Both fail often enough that neither deserves a bigger position than your normal size.
Fair value gaps and imbalance
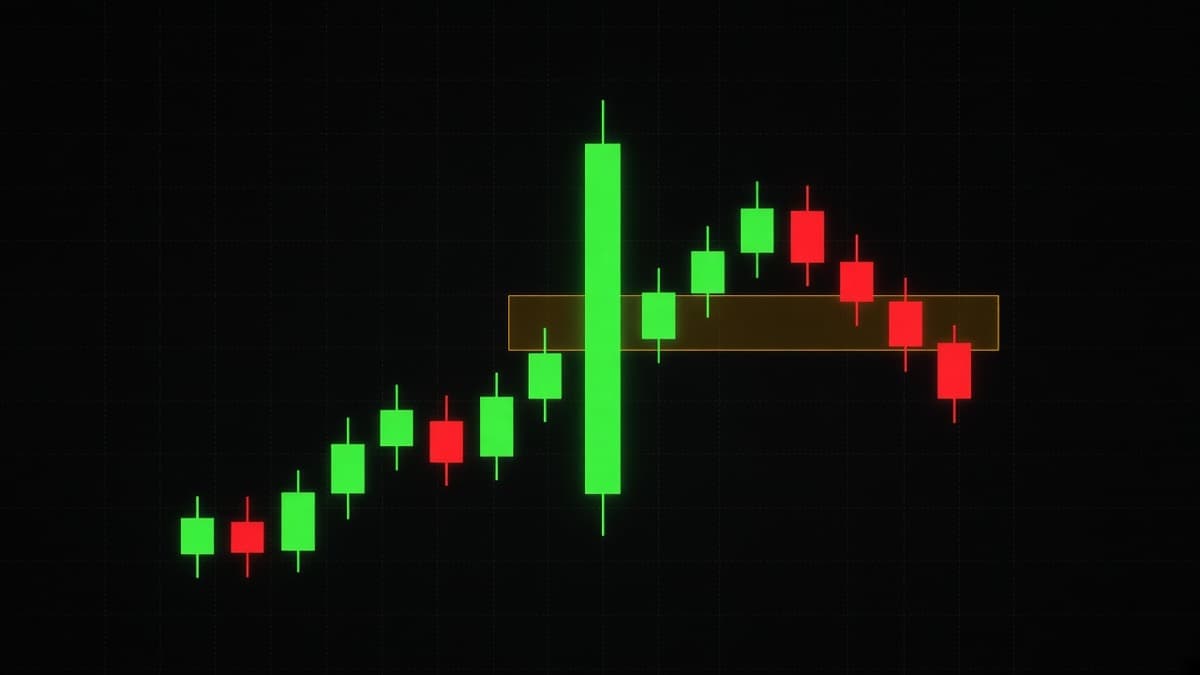
A fair value gap is a three candle pattern. Take candles 1, 2 and 3. If the high of candle 1 sits below the low of candle 3, the band between them is a bullish fair value gap. Price moved through that band so fast that no trading happened at those prices in the normal two-sided way.
The bearish version is the same in reverse: the low of candle 1 above the high of candle 3.
Why traders care: a fast one-sided move leaves business unfinished. The idea is that price often comes back through that band to trade it properly before continuing. Sometimes it does. Sometimes it never comes back at all, and that is the case people forget to plan for.
Two practical points that matter more than the definition:
- A gap left by a move that also broke structure is worth more attention than a gap inside a range. Context first, gap second.
- Most gaps on the 1m chart get filled within the hour. Gaps on the 4h can sit open for weeks. The timeframe you mark on decides how long you are willing to wait.
The full breakdown, including inversion gaps and the 50 percent rule, is in fair value gap explained.
Premium and discount: where in the range are you?
This is the simplest idea in SMC and the one that filters the most bad trades.
Take the current dealing range, meaning the swing low and swing high that price is moving between. Draw a line at the midpoint. The half above the midpoint is premium. The half below is discount.
The rule: you want to buy in discount and sell in premium.
That sounds obvious written down. It is violated constantly. A trader marks a bullish order block, waits for price to come back, and takes the long. The problem is that the order block sits at 72 percent of the range, which means they are buying near the top of the move with the whole range below them as open air.
The midpoint is also useful as a target. If price sweeps a low in discount and rallies, equilibrium is a reasonable first place to take something off. Many moves stall exactly there.
How to pick the range: use the most recent clean swing low to swing high on your structure timeframe. If you cannot decide which swing to use, your structure marking is not clean enough yet. Go back to the previous section.
Mitigation: what "mitigated" means
You will see the word constantly. It means price has come back and traded into a zone.
- An unmitigated order block has not been revisited since it formed.
- A mitigated order block has already been traded back into.
The usual guidance is that the first return to a zone is the one that has the best chance, and after that the zone is used up. There is sense in that. If the zone worked because unfilled interest sat there, the first pass through is when that interest gets taken. What is left afterwards is thinner.
Do not treat it as a hard rule. Plenty of zones get tapped twice and hold both times. The more useful version of the guidance: if a zone has already been tested twice and price is grinding into it a third time with smaller and smaller reactions, the zone is failing. Grinding into a level is different from arriving at it fast, and the difference is visible on the chart.
Putting it together: one setup start to finish
Here is the whole framework applied to a single trade. Use EUR/USD 15m for structure and 1m for entry.
- Structure. The 15m is making higher highs and higher lows. Last higher low is at 1.0811. Direction: long only.
- Range. The current dealing range runs from 1.0811 to 1.0879. Midpoint is 1.0845. Anything above that is premium. You will only look for longs below 1.0845.
- Liquidity. There are two 15m lows at 1.0813 and 1.0812, close enough to call equal lows. That is a shelf of sell-side liquidity just below the structure low.
- Wait. Price drifts down through the session and takes out 1.0811 with a wick to 1.0804, then closes back above 1.0813 on the 15m.
- Confirm on the lower timeframe. Drop to the 1m. You want a fast up candle that closes above the most recent 1m lower high. That is your 1m change of character.
- Find the entry. That fast up move left a 1m fair value gap between 1.0818 and 1.0821, and the last 1m down candle before it sits at 1.0815 to 1.0818. Those two levels overlap into one small band.
- Enter. Limit order in the band, or a market entry on the first 1m candle that trades back into it.
- Invalidation. Below 1.0804, the sweep low. If price trades there, the read was wrong.
- Target. First target is the equilibrium at 1.0845. Second is the range high at 1.0879 where buy-side liquidity is resting.
Notice how many things had to line up. That is the point. If you take every order block you see without the structure, the range position and the liquidity event, you are taking a much lower quality version of the same idea.
The same thing on the short side
GBP/JPY 5m, because it behaves differently and the differences are instructive.
The 1h is in a downtrend, making lower highs. The last lower high is 188.40. Price has been grinding up all through the Asia session and is now at 188.10, which puts it in the top third of the range between 187.20 and 188.40. That is premium, which is where you want to be selling.
There are two 5m highs at 188.36 and 188.38. Close enough to be equal highs, and they sit just under the structural level at 188.40. That is a liquidity shelf.
What you wait for: a candle that trades above 188.40 and closes back below 188.36. On GBP/JPY that wick is often 20 or 30 pips, which looks alarming if you are already short. It is why you wait rather than pre-positioning.
Once you have the sweep, drop to the 1m. You want a fast down candle that closes below the last 1m higher low. That move will usually leave a bearish fair value gap behind it. Sell the gap, invalidate above the sweep high.
The difference from the EUR/USD example is size of the noise. GBP/JPY moves 30 pips while EUR/USD moves 8. Same structure, different scale, and your invalidation distance has to reflect that. If you use the same stop distance on both pairs you will be stopped out of every GBP/JPY trade before it works. Pair behaviour is covered in forex pairs and trading sessions.
Displacement: what makes a move count
Displacement is the word for a move that is clearly one-sided. It matters because every structure break, every order block and every fair value gap is worth more when displacement created it.
What displacement looks like on the chart:
- One or two candles that are visibly larger than the last twenty.
- Small wicks. The candle closes near its extreme rather than in the middle.
- Little to no overlap between consecutive candles. Candle 3 opens above where candle 1 closed.
- A fair value gap left behind. This is the easiest test. If the move did not leave a gap, it probably was not fast enough to call displacement.
What it does not look like: four medium candles that each retrace half of the previous one, then a break of the high. That is drift. Drift breaks structure on paper and then goes straight back the other way.
Use displacement as a filter on everything else. A change of character created by displacement is worth trading. A change of character created by drift is worth watching and nothing more. An order block at the base of a displacement leg is a level. An order block at the base of a slow grind is a random candle you have drawn a box around.
This is also the cleanest answer to "which order block do I use?" when three candidates are stacked on top of each other. Use the one that sits at the base of the fastest leg.
Timeframes: which ones to use
Pick two. One for structure, one for entry. Keep them three to five steps apart.
| Structure timeframe | Entry timeframe | Typical hold |
|---|---|---|
| 4h | 15m | Hours to days |
| 1h | 5m | One to several hours |
| 15m | 1m | Ten minutes to an hour |
| 5m | 15s or 30s | Minutes |
The trap is adding more. If you look at six timeframes you will always find one that disagrees, and you will use it as a reason to skip good trades and to hold bad ones. Two timeframes, one direction, one entry.
For anyone trading short binary expiries, the 15m and 1m pair is the practical default. The 15m tells you which side to take, the 1m tells you when. Expiry choice matters just as much as direction here, and that is covered in binary options expiry times explained.
Does SMC work on short binary expiries?
Partly. Be honest about which parts.
Transfers well: liquidity sweeps and fair value gaps. Both are visible on the 1m, both produce a fast reaction, and both give you a clear invalidation level. If price sweeps a 1m low at 1.0804 and immediately reclaims it, the reaction usually happens in the next two to five candles, which fits a short expiry.
Transfers badly: order block retests. An order block is a zone you wait at. Waiting is exactly what a fixed expiry does not allow. You can be completely right about the zone and still lose because price arrived there ninety seconds after your contract closed.
Does not transfer: anything involving holding through a retracement. A spot trader can sit through a 15 pip drawdown and still be fine. On a 1 minute binary there is no drawdown, only a result.
The other thing to be honest about: the OTC pairs on Quotex are synthetic instruments, not the interbank market. The structure you are reading there is real price structure generated by the feed, and it does respond to the same patterns, but the liquidity story about resting bank orders does not apply in the same way. Read the structure. Skip the narrative. More on how the two feeds differ in how REDBERRY generates Live and OTC signals.
What smart money concepts does not do
Worth saying plainly.
It does not tell you position size. Structure gives you an invalidation level. Turning that into a stake is a separate skill, and it is the one that actually decides whether you survive. Start with risk management for binary trading.
It does not remove losing trades. A clean order block in discount after a liquidity sweep will still fail regularly. The setup gives you a better than random read and a tight invalidation. That is the product.
It does not let you see institutional orders. No retail data feed shows you that. Anyone selling a course on the basis that it does is selling you something else.
It does not fix the decision-making problem. Most accounts are lost to over-trading and revenge trading, not to bad pattern recognition. Trading psychology and discipline matters more than another entry model.
Common mistakes with SMC
Marking every candle as an order block. If your chart has fourteen zones on it, none of them mean anything. A 15m chart should have two or three zones you actually care about at any one time.
Ignoring the higher timeframe. A perfect 1m bullish setup inside a 15m downtrend that just broke structure down is a trade against the flow. Sometimes it works. Usually it gives you a small win followed by a large loss when the trend resumes.
Using wicks for structure breaks. A wick through the last higher low is a sweep, not a break. Waiting for the close changes the read completely and removes most false CHoCH signals.
Redrawing structure after the fact. If you find yourself moving your swing low once price has already gone through it, you are not analysing, you are rationalising. Mark it, then leave it.
Believing the story instead of reading the chart. The narrative about institutional intent is not what makes the setup work. The observable behaviour around obvious levels is. Keep the second, drop the first.
Skipping range position. Buying an order block in the top quarter of the range is the most common way to take a technically valid setup and still lose. Check the midpoint every time.
How this connects to the rest of the chart
SMC is not separate from classical technical analysis. The overlap is almost total once you strip the vocabulary.
| SMC term | Classical equivalent |
|---|---|
| Bullish order block | Demand zone, last down candle base |
| Bearish order block | Supply zone |
| Break of structure | Trend continuation, higher high confirmed |
| Change of character | Trendline break, first lower high |
| Liquidity sweep | Stop run, false break, spring |
| Equal highs | Double top resistance |
| Fair value gap | Imbalance, runaway gap area |
| Premium and discount | Upper and lower half of a Fibonacci range |
| Breaker block | Broken resistance turned support |
If you already know chart patterns and candlestick patterns, you know most of this. What SMC adds is the habit of being exact: this candle, this wick, this half of the range.
The reverse is also true. A liquidity sweep at a level very often prints as a hammer or a long-wicked rejection candle, and a change of character very often completes a head and shoulders. The candle and the structure are describing the same event at different zoom levels. Use both.
The terms in one table
Keep this somewhere while you are learning. Most SMC confusion is vocabulary confusion.
| Term | Short form | What it means on the chart |
|---|---|---|
| Break of structure | BOS | Close beyond the last swing in the direction of the trend |
| Change of character | CHoCH | First close beyond the last swing against the trend |
| Order block | OB | Last opposing candle before the move that broke structure |
| Breaker block | BB | Order block that failed, got broken through, and now works the other way |
| Mitigation block | MB | Order block at a swing point whose liquidity was never taken |
| Fair value gap | FVG | Band between candle 1 and candle 3 of a fast three candle move |
| Imbalance | IMB | Same idea as a fair value gap, used loosely |
| Inversion fair value gap | IFVG | Gap that price closed through, now used from the other side |
| Liquidity sweep | Sweep | Wick beyond an obvious high or low that closes back inside |
| Buy-side liquidity | BSL | Resting orders above highs |
| Sell-side liquidity | SSL | Resting orders below lows |
| Inducement | IDM | The obvious level in front of the real one |
| Premium | Upper half of the current range | |
| Discount | Lower half of the current range | |
| Equilibrium | EQ | The 50 percent line of the range |
| Displacement | A fast one-sided move, usually leaving a gap | |
| Mitigated | Price has already traded back into the zone |
The abbreviations are everywhere in SMC discussion and they are worth recognising even if you never use them yourself.
Where the terminology comes from
Much of the current SMC vocabulary, including killzones, optimal trade entry, judas swing and the power of three, comes from the teaching of Michael J. Huddleston, who publishes under the name Inner Circle Trader. The order block and liquidity language predates that and shows up in older supply and demand and order flow material too.
None of that should change how you evaluate the ideas. Test them on your own pairs and your own timeframes. The session and entry model side of it is covered in ICT trading concepts.
How REDBERRY uses structure
For context on where this fits with the desk: REDBERRY reads live market structure rather than asking you to mark it by hand.
Live pairs run on the TradingView API, which supplies realtime price and chart structure, and the inbuilt strategies work from that to predict the next move. OTC pairs use private Quotex API access for a live OTC price feed, with the same inbuilt strategies applied on top.
Signals are not 100 percent accurate, and no read on the next candle ever is. Knowing what structure looks like still matters, because a signal you understand is one you can size properly and skip when the context is wrong. REDBERRY is a non-profit informational desk, not a broker, and the trade decision stays with you. The setup is described in more detail in what REDBERRY actually is.
A practice routine that works
If you want this to be usable rather than interesting, do the following for three weeks on one pair.
- Open EUR/USD 15m. Mark the last ten swing highs and swing lows using the two-candle rule. No other drawings.
- Label each break as BOS or CHoCH. Write the price of the level that broke.
- Draw the current dealing range and its midpoint.
- Mark the two most obvious liquidity levels: the nearest equal highs and the nearest equal lows.
- Only then look for an order block or a gap, and only in the correct half of the range.
- Write down what you expected. Come back the next day and check.
One pair. One timeframe pair. Three weeks. Most of the skill is in step one, and most people skip it to get to step five.
Questions people ask
What are smart money concepts in simple terms?
It is a set of names for things you can see on a price chart: the swing highs and lows that define a trend, the levels where a lot of stop orders probably sit, the candle right before a fast move, and the price bands a fast move skipped over. Put together, the names give you a repeatable way to describe where you are entering and why.
Is SMC better than support and resistance?
It is mostly the same information described with more precision. A support level and a demand zone mark the same area. SMC forces you to say which candle, which wick and which half of the range, and that precision is where the value is. It is not a different market.
Do banks really hunt retail stop losses?
Nobody can prove that from a retail chart. What you can observe is that price often reaches obvious levels where orders cluster, trades through them, and then reverses. Resting orders at obvious prices are a market structure explanation for that behaviour. Treating it as a documented conspiracy is going further than the evidence goes.
Which timeframes work best for smart money concepts?
Pick one timeframe for direction and one for entry, usually three to five steps apart. A common pair is 15m for structure and 1m for the entry. Using six timeframes at once produces one bullish and one bearish read at all times, which is the same as having no read.
Can smart money concepts be used on one minute binary expiries?
Parts of it can. Liquidity sweeps and fair value gaps show up clearly on the 1m chart. The problem is that a one minute expiry gives the idea no room to work, so a correct read on direction can still finish as a loss if the timing is off by two candles. Size accordingly.
How long does it take to learn SMC properly?
Marking structure correctly on one pair takes a few weeks of daily practice. Learning which setups to skip takes much longer. Most of the improvement comes from cutting the marginal trades, not from finding new patterns.
Nothing here is financial advice. Signals and setups can be wrong, so only risk money whose loss will not change your life.